BTC/USDT - 4HR CHART ANALYSIS
CURRENT MARKET SITUATION (JULY 20, 2025, 10:16 AM IST):
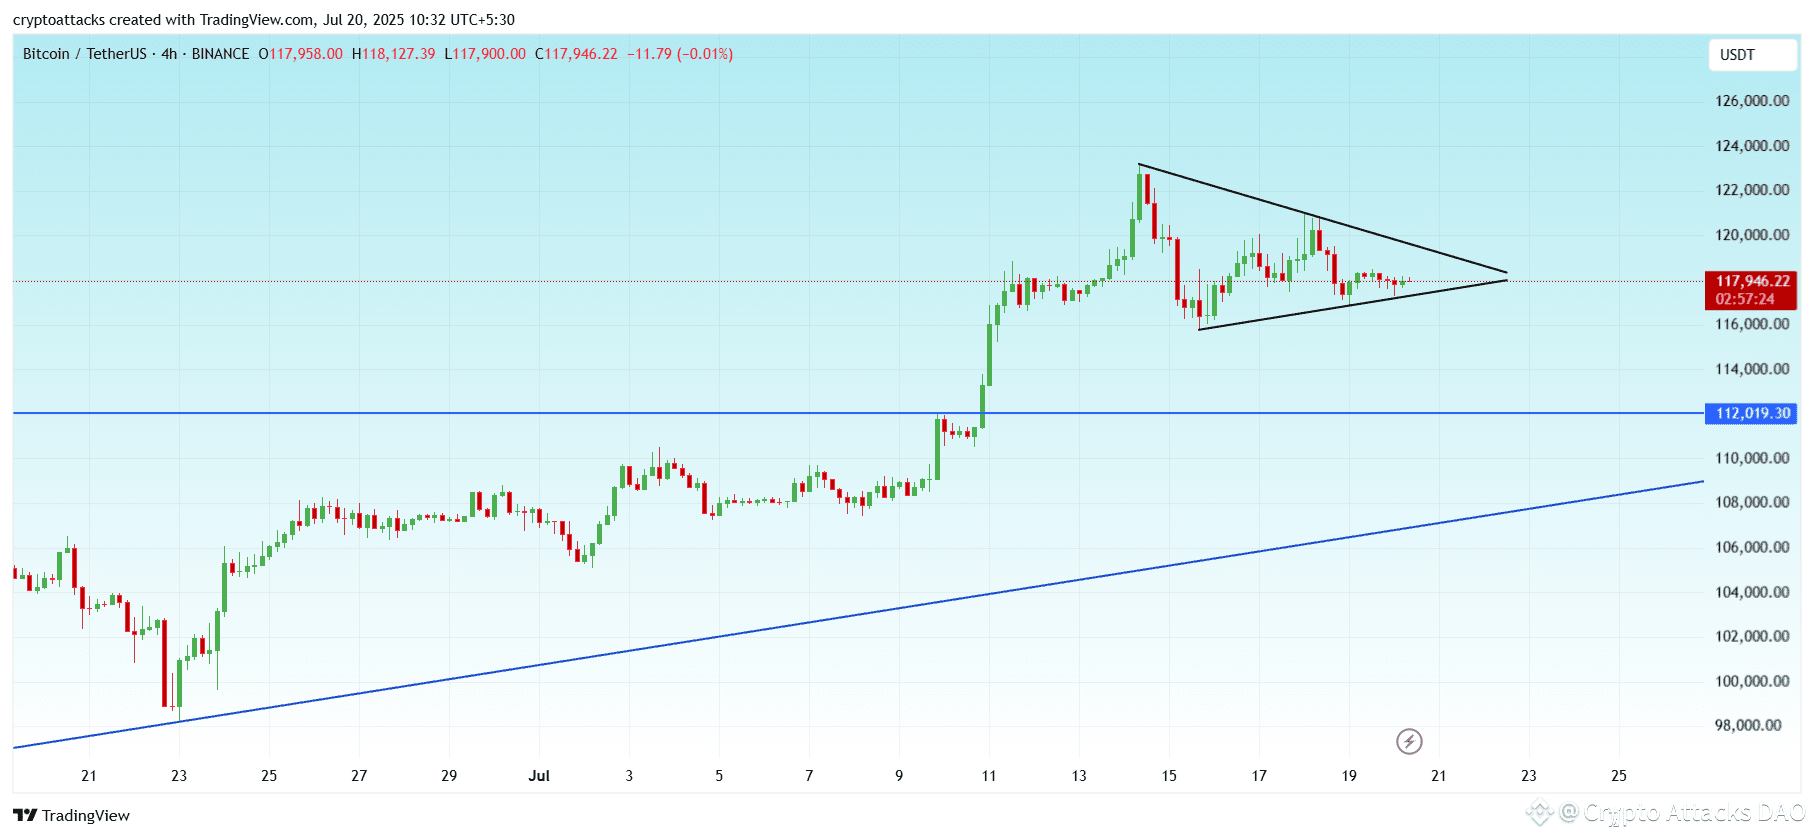
Bitcoin (BTC) is currently consolidating within a Symmetrical Triangle pattern after a significant bullish impulse. This pattern typically signifies market indecision and often acts as a continuation pattern, meaning the prior trend (bullish in this case) is likely to resume. However, a breakdown is also a possibility.
KEY OBSERVATIONS:
Price Action: BTC is trading near the apex of the symmetrical triangle, indicating increasing volatility leading up to a potential breakout.
Support Levels:
Dynamic Triangle Support: The lower trendline of the symmetrical triangle is providing immediate support.
Major Horizontal Support: The 112,000 USDT level (marked by the blue line) is a critical historical resistance-turned-support level. A strong bounce off this level previously propelled the price higher.
Resistance Levels:
Dynamic Triangle Resistance: The upper trendline of the symmetrical triangle is acting as immediate resistance.
MACD (12, 26, Close):
The MACD lines are converging towards the zero line, with the histogram showing decreasing momentum (slightly negative). This suggests the strong bullish momentum from the previous rally has subsided, and the market is in a consolidation phase. It does not yet indicate a strong bearish reversal.
ACTIONABLE SCENARIOS (BASED ON POTENTIAL BREAKOUTS):
SCENARIO 1: BULLISH BREAKOUT (HIGH PROBABILITY - CONTEXT OF PREVIOUS UPTREND)
Trigger: A decisive 4-hour candle close above the upper trendline of the symmetrical triangle, ideally accompanied by a significant increase in trading volume.
Confirmation: A retest of the broken trendline as support, followed by a bounce.
Potential Target: Based on the height of the triangle, potential targets could be in the range of 122,500 USDT to 125,000 USDT and potentially higher, depending on the strength of the breakout.
Invalidation (Stop Loss for Longs): A clear break and close below the lower trendline of the symmetrical triangle, or below the 112,000 USDT major support.
SCENARIO 2: BEARISH BREAKDOWN (LOWER PROBABILITY - BUT POSSIBLE)
Trigger: A decisive 4-hour candle close below the lower trendline of the symmetrical triangle, ideally accompanied by a surge in selling volume.
Confirmation: A retest of the broken trendline as resistance, followed by rejection.
Potential Target: A breakdown could lead to a retest of the 112,000 USDT major support. A break below that could open doors to lower levels, potentially around the upward sloping trendline from late June.
Invalidation (Stop Loss for Shorts): A clear break and close back above the upper trendline of the symmetrical triangle.
RECOMMENDATION (BASED ON WAITING FOR CONFIRMATION):
Currently, the market is in an indecisive consolidation phase. Therefore, the most prudent approach is to:
[HOLD / WAIT FOR CONFIRMATION]
DO NOT ENTER A POSITION UNTIL A CLEAR BREAKOUT OCCURS.
Monitor the price action closely at the triangle boundaries.
Set price alerts for breakouts above/below the triangle.
This is a high-probability setup for a significant move once the pattern resolves. Patience is key.
RISK MANAGEMENT IS PARAMOUNT! ALWAYS USE APPROPRIATE STOP-LOSS ORDERS AND MANAGE YOUR POSITION SIZING.
DISCLAIMER: This analysis is for educational purposes only and does not constitute financial advice. Trading cryptocurrencies involves substantial risk of loss and is not suitable for every investor. You should consult with a qualified financial professional before making any investment decisions.