Bitcoin’s weekend dip to $117 800 USDT looks tame on the ticker (-0.29 % 24 h) yet masks a three-way tug-of-war between wall-to-wall ETF demand, sticky U.S. inflation, and cooling derivatives froth. Here’s the full story of what shaped price action over 19 – 20 July 2025 and the tell-tales to watch before the next $BTC sprint.
1️⃣ Price Action: A Micro-Range With Macro Weight
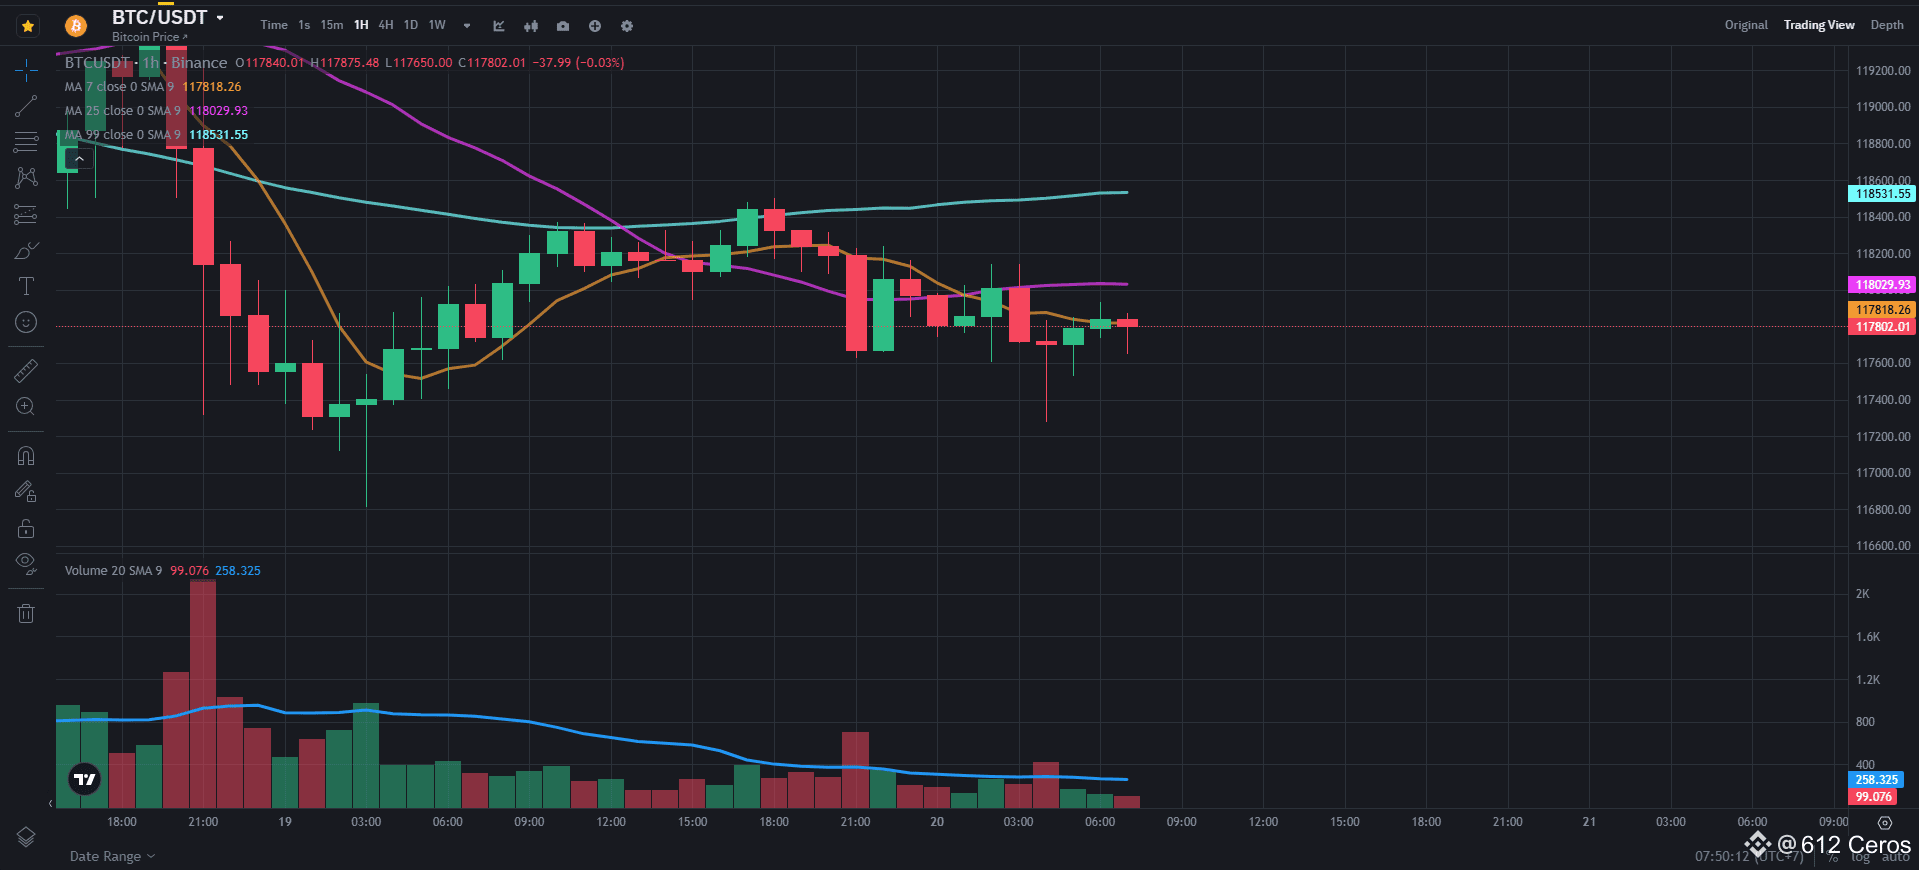
BTC has ping-ponged inside $116 600 – $118 800 for five sessions, each breakout attempt smacking into the $119 250 – $120 700 supply shelf.
Bulls cling to a 50 % Fib at $115 800 from the $108 636 → $123 140 impulse; lose that and the 200-day EMA near $113 700 lights up.
Spot turnover still clocked US $47 B in 24 h, keeping liquidity deep even as price drifted.
2️⃣ Demand Engine: ETFs Keep Siphoning Coins 🏦
U.S. spot-BTC ETFs just notched two straight $1 B+ net-inflow days, a first since launch—$2.7 B for the week.
Thursday’s $1.17 B haul equaled nearly 22 × the day’s mined supply; BlackRock’s IBIT and Fidelity’s FBTC own over 60 % of July subscriptions.
Glassnode shows -14 600 BTC seven-day exchange outflows as holders shuttle coins to cold storage after the ETF grab.
3️⃣ Macro Brake: Inflation Won’t Blink 🏛️
June CPI ticked up to 2.7 % y/y, a second consecutive rise, knocking odds for a July Fed cut to near zero.
Dallas Fed’s Lorie Logan signaled rates could stay 5.25-5.50 % “a while longer,” citing tariff-driven price stickiness.
Result: the DXY punched 98.5, adding gravity right at Bitcoin’s psychological $120 K lid.
4️⃣ Derivatives Pulse: Heat, Then Hibernate 📉
Open interest remains near the record US $27 B, yet funding cooled to +0.005 %/8 h from last week’s overheated +0.02 %.
Tuesday’s failed upside break triggered US $1 B in short liquidations—the biggest since January—leaving traders gun-shy.
CME now controls >70 % of cash-settled OI, underscoring an institutional hedging bias.
5️⃣ Three Scenarios on the Radar 🔭
• Bull-Continuation (40 %): A daily close above $120 700 with ETF inflows unabated catapults price toward $123 200 → $125 000.
• Range Lock (35 %): ETFs keep soaking supply, but firm CPI and Fed jawboning box price between $113 700 – $120 700 through month-end.
• Deeper Pull-Back (25 %): Funding flips negative and hawkish Fed chatter resurfaces—watch $110 500, then $107 000.
6️⃣ Signals to Track This Week 📅
Funding-rate flips: sustained sub-zero prints could flag bearish leverage.
OI spikes vs. flat price: hints at new traps for over-confident longs.
Macro tape: PPI data and back-to-back Fed speeches on Thursday may reset dollar strength—or sharpen it.
Take-Away 📝
ETF hunger and long-term holders remain the structural floor, but hotter-for-longer inflation keeps the ceiling heavy. Until the macro tone cools or derivatives conviction returns, Bitcoin is hostage to the narrow battlefield under $120 K. Stay nimble, respect your stops, and let the tape confirm the breakout—or breakdown.
💬 Think $BTC rips above $125 K next, or are we headed for $110 K first? Drop your call below!
👉 Click $BTC to open the live chart—every tap fuels your Write-to-Earn streak and bankrolls deeper market dives. 🔥
📜 DYOR – Not financial advice. Crypto remains volatile; past ETF inflows don’t guarantee future gains.
