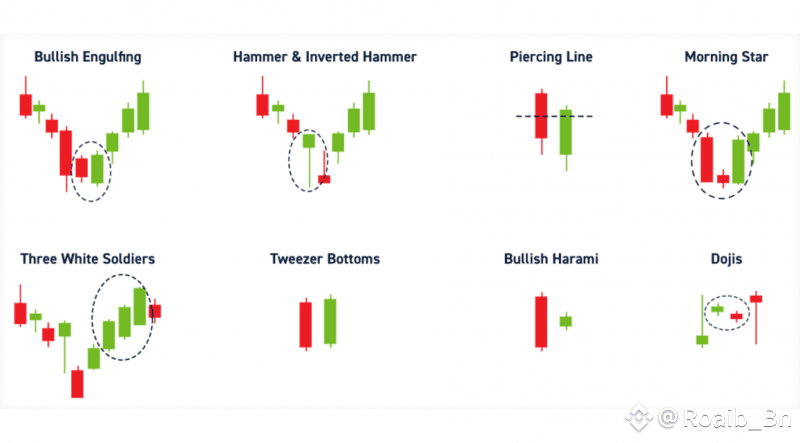
🔹 Bullish Engulfing
A small red candle followed by a large green one that engulfs it completely — a classic signal of buying strength and a trend reversal.
🔹 Hammer & Inverted Hammer
Hammers appear at the bottom of downtrends, with long lower wicks, indicating strong rejection of lower prices. Inverted hammers hint at potential reversals.
🔹 Piercing Line
The green candle opens below the red one’s close and closes above its midpoint — a strong bullish reversal pattern signaling a bounce.
🔹 Morning Star
A three-candle setup showing a downtrend weakening, often marking the beginning of an uptrend after a period of selling pressure.
🔹 Three White Soldiers
Three consecutive green candles with higher closes — a powerful sign of sustained buying momentum and trend reversal.
🔹 Tweezer Bottoms
Two candles with matching lows often indicate a strong area of support and potential for a bullish reversal.
🔹 Bullish Harami
A small green candle contained within a large red one. It reflects indecision and possible reversal as selling pressure eases.
🔹 Dojis
Candles with very small bodies showing market indecision. When found at the bottom of a trend, they often hint at upcoming reversals.
---
💡 Pro Tip: Combine these patterns with volume and RSI to boost your confirmation accuracy!
HERE is the candles image 👇
IF YOU FIND THE POST HELPFUL THEN PLEASE FOLLOW LIKE AND COMMENT ON IT THANKS 👍
#CryptoMarket4T #GENIUSAct #BinanceHODLerC #AltcoinBreakout #BinanceHODLerERA


