Considering that most assets are approaching key resistance levels, the market's upward trend may continue

Dogecoin (DOGE) is releasing strong rebound signals, and the latest trend may indicate that the largest technical breakthrough since 2025 is about to unfold. The current DOGE quote is $0.21, which has successfully broken through the key resistance area, continuing the previous rebound momentum, with an intraday increase of about 1%.
Chart data shows that DOGE has broken through the long-term suppressed 200-day moving average (black line), which is the first time it has stood on this key technical indicator in months, marking a positive shift in the trend.
It's not just the price increase; the matching of trading volume and the overall optimistic atmosphere in the market jointly support this breakthrough. Especially after the rising wedge structure formed at the end of June was broken upward, this move was technically confirmed, strengthening the bullish confidence of market participants.
In addition, DOGE has also broken through the previously important psychological barrier of $0.20, further opening up space for upside.
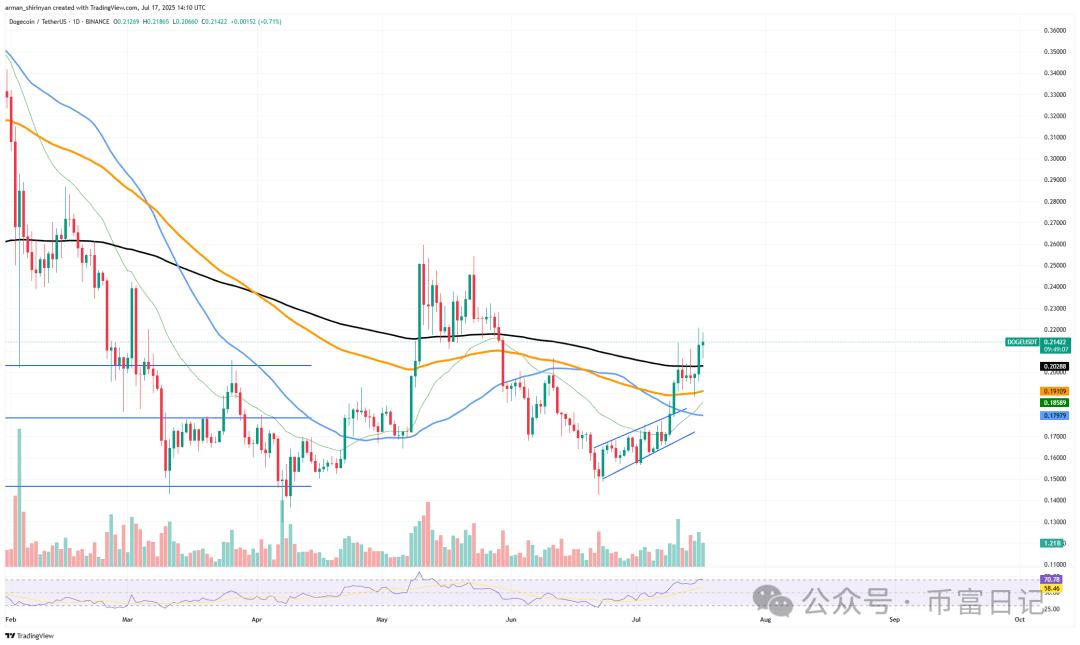
With the RSI breaking 70, Dogecoin has now officially entered the overbought zone. However, bulls should not stop there, because in a trending market, the RSI may remain overbought for a long time as prices continue to rise. The next reasonable resistance level is around $0.25, a level not seen since early May. If Dogecoin maintains its momentum and trading volume keeps up, it may rise in this direction and may even break this level.
The overall bullish environment in the cryptocurrency market also provides the tailwinds needed for Dogecoin (DOGE) to grow in the long term. Investors should pay close attention to whether this rise can attract speculative momentum and retail trading volume. Since the prosperity of Dogecoin (DOGE) depends on the hype cycle, this technical breakthrough may give rise to a new story.
Shiba Inu needs more
As 'Shiba Inu' once again faces a critical moment on the chart, a single technical level - the 200-day exponential moving average (EMA) - is the focus of attention. SHIB is currently rebounding to the 200-day EMA negative line, which has historically been an important resistance level for the asset after a strong rebound in the previous few weeks.
SHIB has rebounded strongly from a local low of $0.00001230, and the current price has risen to approximately $0.0001437. However, if it fails to break through the key technical resistance of the 200-day moving average, the current rebound may just be a 'bull trap'.
Although the short-term bullish strength has obviously increased, the market is approaching a key inflection point. If SHIB fails to effectively stand above the 200-day moving average, the price is likely to quickly fall back to the $0.00001300 area - this level has been verified as strong support many times before.
From a technical indicator perspective, the RSI has risen to 71 and entered the overbought zone, suggesting that the short-term upward momentum may gradually weaken.
However, if SHIB successfully breaks through and stabilizes on the 200-day moving average, the next stage target for bulls will point to the $0.00001550 area, a level that has not been reached since early May. If this breakthrough is achieved, it will also provide technical support for building higher highs and confirming trend reversal.
In short, SHIB needs to break through the 200-day moving average to remain competitive. If it fails to do so, this meme token will likely experience another stagnant rebound and callback. SHIB is at a critical moment, and the trend in the next few weeks will depend on the next move.
XRP's Surge
As XRP continues to show a parabolic rise and outperforms other parts of the cryptocurrency market, it has officially entered a thriving stage. After months of consolidation, XRP experienced an explosive breakthrough, soaring from below $2.20 to above $3.20 in just a few weeks. Judging from the scale and magnitude of this rise, irrational prosperity is sweeping the asset.
The current market sentiment is highly consistent with the technical aspects. XRP's relative strength index (RSI) has risen to 85, which is in an extremely overbought level. This is historically rare and often means that the market is about to enter a consolidation period, or even a significant correction. However, in the current bull market environment dominated by speculative enthusiasm and FOMO sentiment, asset prices may continue to run high in the overbought range for a period of time.
More noteworthy is that the trading volume has increased simultaneously, which means that this round of rise is not an isolated event, but is driven by strong capital participation. However, if the momentum weakens and the buying follow-up is insufficient, the risk of forming a local top in the short term cannot be ruled out. Especially under the current steep upward rhythm, once the market sentiment changes, XRP may face the pressure of rapid profit-taking.
Nevertheless, the structurally bullish trend remains intact. Earlier this month, XRP effectively broke through the rising triangle pattern and strongly crossed multiple resistance zones. The three major moving averages (50, 100, and 200 EMA) also maintain a bullish arrangement, providing support for the medium-term trend.
As for the future trend, if the upward momentum continues and the trading volume remains high, XRP is expected to further impact higher levels and may still have upside space before touching the $3.50–3.80 area.


