
Source: The Week On-chain, Glassnode
Translation: Golden Finance xiaozou
Bitcoin reached a historic high, with the highest trading price reaching $122,600, bringing all BTC investors back into profit. According to key on-chain indicator analysis, if historical patterns hold, prices may continue to probe the $130,000 mark before demand exhausts.
Summary of this article:
• Bitcoin successfully broke through historical highs and stood firmly above two key accumulation ranges, showing strong bullish trends and a recovery of investor confidence.
• Short-term holders currently have substantial unrealized profits, driving multiple indicators describing this type of investor into the overheating range.
• We observed that the first wave of tokens realized high profits after breaking historical highs, which is a typical behavioral characteristic of market euphoria.
• The realized profit-loss ratio once surged sharply, breaking the +2 standard deviation threshold, and later retreated to a more moderate level in the latter part of this week.
Historical patterns indicate that market tops often form after investors have repeatedly taken profits. If Bitcoin demand remains resilient and the market rises again, the $130,000 price range will become the next significant resistance level. Despite the continuation of the bullish trend, signs of pressure on the demand side suggest that caution should be maintained recently.
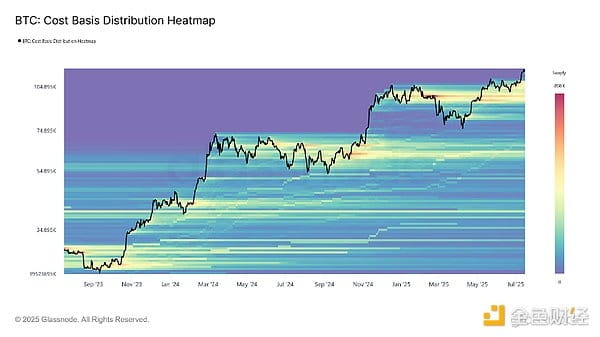
1. Breakthrough of accumulation range
After several weeks of fluctuation in the $100,000-$110,000 range, Bitcoin regained upward momentum and broke through the historical high of $122,000. The cost basis distribution heat map shows that during this consolidation phase, there was dense accumulation in the price ranges of $93,000-$97,000 and $104,000-$110,000. After successfully breaking through these dense supply areas, this region may transform into strong support, forming a potential foundation for future market pullbacks.
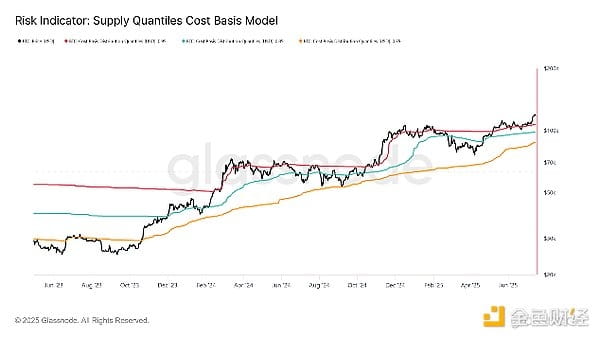
2. Return to price discovery phase
As Bitcoin enters a new round of price discovery, the vast majority of circulating supply is currently in profit. According to the cost basis distribution quartile model, the spot price has surpassed the 95% quantile line of $107,400. This model has special value in identifying potential market top formation periods—when prices rapidly break through the 95% quantile line, it often triggers a profit-taking wave due to the expansion of the holder base, ultimately redistributing supply to higher cost price levels. If such selling activity continues to accumulate, it may create a top-heavy market structure: a large number of investors holding high-cost chips, making the overall investor group increasingly sensitive to price fluctuations.
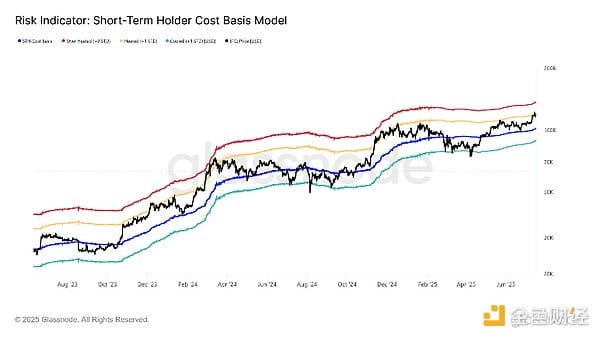
3. Early signs of overheating
Bitcoin fell to $115,900 after reaching a historic high of $122,600, a trend consistent with investors increasing selling pressure as the market strengthens. This pullback occurred after prices briefly broke above $120,000 (i.e., above the short-term holder's cost basis + 1 standard deviation). Historical data shows that this level often becomes a natural resistance point, especially during times of heightened speculative sentiment. If the current upward momentum is maintained, the next key resistance level will be in the +2 standard deviation range (currently around $136,000).
4. Bull Market Compass
Given that the market has confirmed entry into a short-term overheating state, the following will focus on identifying key indicators of extremely high-risk market structures. By utilizing these indicators, we aim to outline the market conditions that typically appear before significant tops or sharp pullbacks.
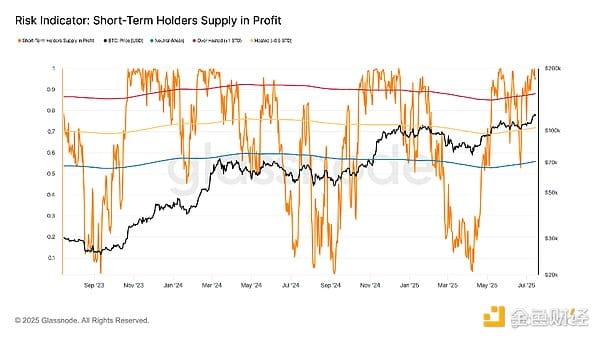
To measure the profitability dominance of recent investors, we use the profit supply ratio of short-term holders. This indicator is currently at 95%, which is more than 1 standard deviation above the long-term mean of 88%, indicating that new market entrants are enjoying significant growth in unrealized profits.
This is the third time since early May 2025 that this indicator has breached the critical value, reinforcing the judgment that the market is entering a more frenzied phase. If this indicator begins to stabilize or fall below 88%, it could signal a weakening demand or distribution of chips.
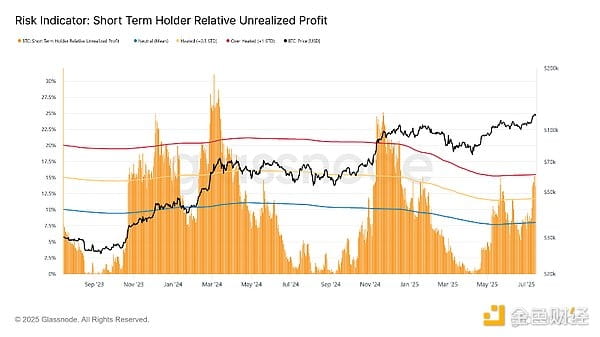
To assess the degree of unrealized profits held by these investors, we turn to the unrealized profit indicator for short-term holders. This indicator just touched the overheating threshold of 15.4% (mean + 1 standard deviation) before retracting to 13.6%, reflecting a moderation in unrealized gains during the price pullback.
Historical data shows that this area often marks the beginning of a top formation—due to the ongoing profit-taking behavior of short-term holders, top formations usually exhibit lagging characteristics. Given that these investors respond quickly to price changes, this indicator is crucial for capturing early signs of demand exhaustion.
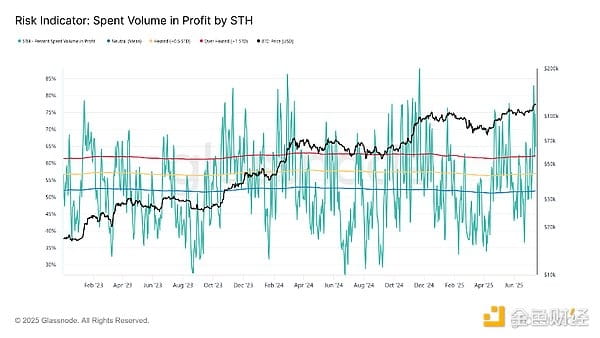
As unrealized profits have entered the overheating range, it is anticipated that short-term holders will accelerate the selling of profitable chips. Such behavior will be confirmed when the profit trading volume of short-term holders breaks above the upper band of 1 standard deviation.
This pattern often indicates that demand is about to exhaust. So far, we have observed the first wave of large-scale profit-taking since the peak at the end of 2024.
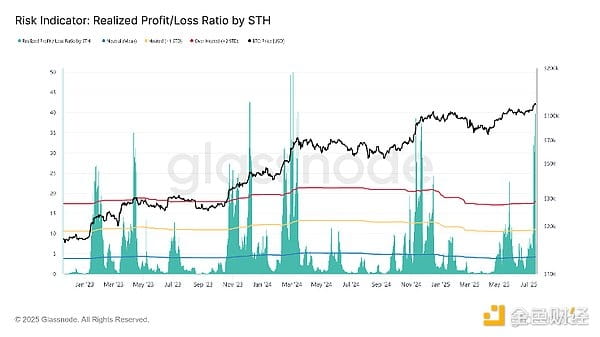
In addition to the profit trading volume ratio, we can also assess the intensity of profit realization through the realized profit-loss ratio. This indicator recently surged to 39.8, far exceeding the +2 standard deviation threshold, and then retreated to 7.3—while still at a high level, it has moderated relative to the bullish market environment.
Multiple breaches of the overheating range can serve as a strong signal for extreme profit-taking activities, which will ultimately exhaust the inflow demand for the entire market.
5. Conclusion
Bitcoin has broken through two major dense accumulation areas, and such structural breakthroughs usually indicate strong ongoing upward momentum. However, short-term holders, as a more sensitive group, are currently in the overheating range of unrealized profits, which is likely to trigger more severe profit-taking behavior.
Currently, the profit trading volume ratio and the realized profit-loss ratio have both issued the first round of excessive profit-taking signals. Historical experience shows that such top formations often occur in multiple rounds, indicating that the market still has potential upward space, possibly probing above the short-term holder's cost basis +2 standard deviation range (about $130,000).

