
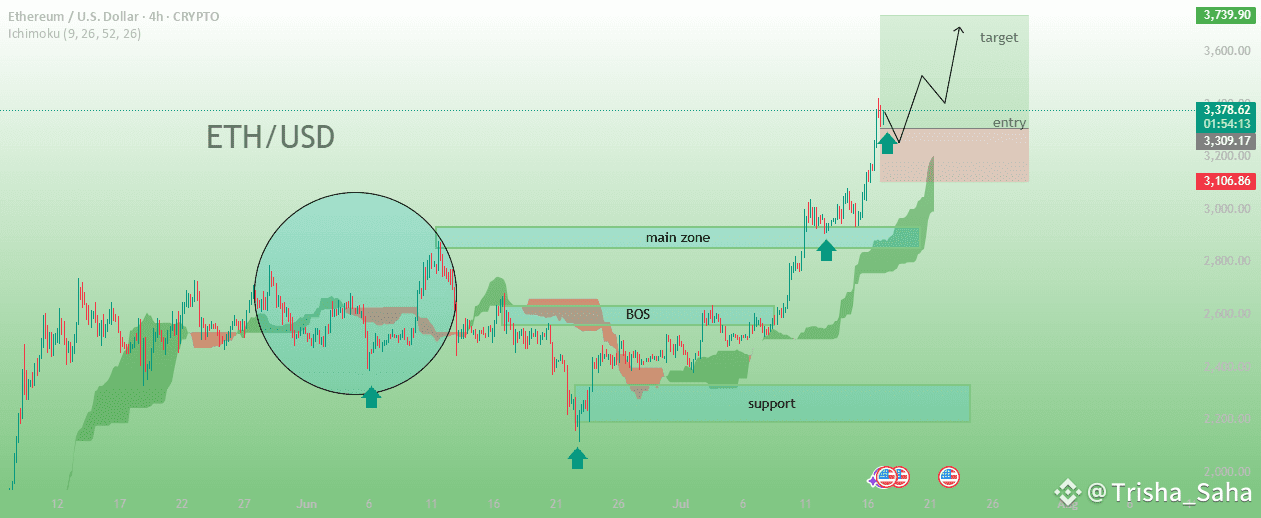
The chart clearly depicts a bullish structure with a breakout from a consolidation phase.
Price is trading well above the Ichimoku Cloud, indicating strong bullish momentum.
🟦 Key Zones Marked
1. Support Zone (bottom blue box):
Identified where price found demand and reversed upwards.
Acts as a demand zone and base of the recent rally.
2. Main Zone (mid blue box):
Previously a consolidation/resistance zone, now flipped as support.
Price broke structure (BOS) here and retested it, confirming strength.
3. Entry & Target (top red/green box):
This is a long trade setup:
Entry: Marked on pullback to the breakout zone.
Target: A bullish projection after confirming support and structure.
🔄 BOS – Break of Structure
A BOS is highlighted, confirming a change from bearish/consolidation to bullish structure.
Signals smart money or institutional interest pushing price higher.
---
🧠 Strategic Insight
The setup uses a smart money concept: price moves from support, breaks resistance, retests, and continues upward.
The Ichimoku Cloud confirms:
Bullish sentiment as price is above cloud.
Leading span is green, supporting bullish continuation.
---
🛠️ Trade Plan (Based on Chart)
Entry: On minor pullback into marked “entry” zone.
Stop Loss: Likely below the “main zone” or cloud support.
Target: As shown in green zone; aiming for higher highs after breakout.
#BinanceHODLerERA #AltcoinSeasonLoading #BTCWhaleTracker #BTC120kVs125kToday #USCryptoWeek