
Bitcoin's Record High Meets Resistance: Can Bulls Push to $136K?
Fresh off etching a new pinnacle above $123,000, Bitcoin (BTC) experienced a jarring price contraction, plummeting swiftly to lows near $115,700. This volatility reignites the critical debate: is this a fleeting pause within a powerful ascent, or the first tremor of a more significant retreat?
Market Whiplash Follows New Peak
The euphoria surrounding Bitcoin's latest historic high proved short-lived. Almost immediately after breaching the $123,000 barrier, intense selling pressure materialized, dragging the price down sharply to the $115,700 region. However, demonstrating underlying resilience, BTC has since clawed back significant ground, currently finding equilibrium near its present trading levels. This rapid recovery suggests the dip attracted strong buyer interest.
Analysts See Correction, Not Capitulation
On-chain experts interpret this event not as a trend reversal, but as a necessary cooldown within a broader bullish phase. Key metrics tracking unrealized gains among recent investors (those holding BTC for less than 155 days) remain in territory historically associated with further upside potential. This analysis points toward a plausible trajectory targeting the $136,000 zone. Conversely, should bearish forces intensify, a retreat towards the established consolidation range near $101,000 remaina technical possibility.
Peak Indicators: Still Room to Run?
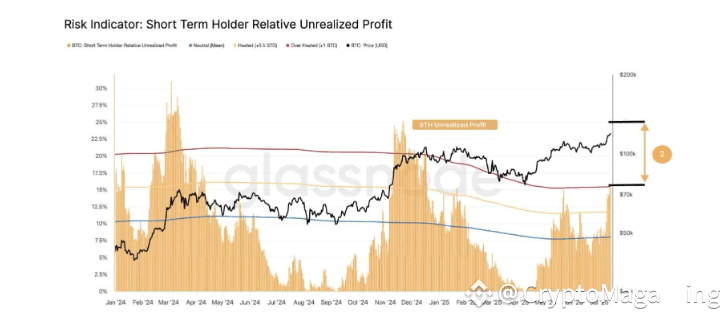
Despite the new nominal high, several analytical tools suggest Bitcoin may not yet have exhausted its upward momentum. A crucial gauge, the Short-Term Holder Profit Realization Index, segments market sentiment into neutral, elevated, and overheated phases. Historically, interim peaks frequently coincide with the index entering the "elevated" (yellow) zone – observed earlier this year in January and April. Current data from Glassnode reveals the index lingering below this critical threshold, implying the market isn't exhibiting the classic exhaustion signals of a major top.
Further bolstering the optimistic case, Bitcoin continues to trade firmly above its Mid-Term Volume-Weighted Average Price (VWAP). This technical anchor, which accounts for both price and trading volume, reinforces the notion that the primary trend remains constructive.
Timeline Speculation: Potential Rally Duration
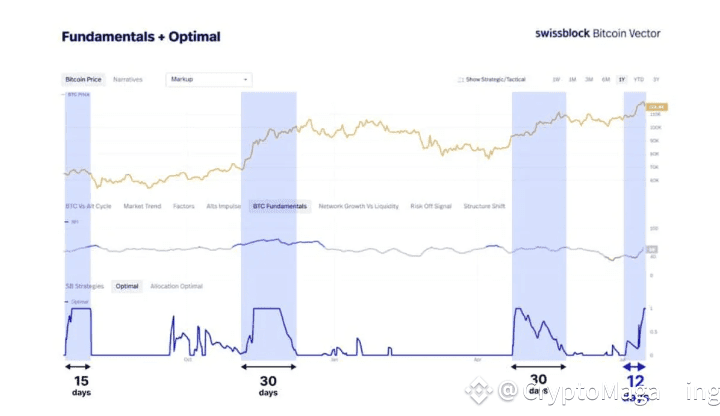
Applying the Bitcoin Vector Optimal Signal, which identifies cyclical expansion phases, places BTC approximately 12 days into its current bullish cycle. Historical parallels show such advances typically persist for 15 to 30 days. Should this pattern hold, Bitcoin could potentially enjoy another 3 to 18 days of upward momentum before encountering a significant corrective phase.
🔹 Bullish Pathway: Sustained momentum could propel BTC toward the $136,000 target. This aligns with the +2 standard deviation band above the recent cost basis for short-term holders – a zone often flagged as "overheated" and prone to triggering pullbacks or local tops.
🔹 Bearish Contingency: Failure to maintain upward pressure could see Bitcoin test a crucial support band between $101,000 and $109,000. A decisive breach of this floor might open the door for a deeper slide toward $93,000-$97,000, potentially pushing prices temporarily below the psychologically significant $100,000 level.
The Verdict:While the sharp correction underscores Bitcoin's inherent volatility, prevailing on-chain metrics and technical indicators lean towards interpreting this as a recalibration within a still-intact uptrend. The path to $136,000 remains plausible, contingent on bulls defending key support levels and the market avoiding premature exhaustion signals. Traders should remain acutely aware of both the significant upside potential and the defined downside risk zones in the coming weeks.
#BTC120kVs125kToday #BTC #Write2Earn
