In this chapter, we will learn the application of candlestick patterns together, today sharing bullish candlestick combinations. The night is about to pass, a beautiful day is about to begin, the appearance of the morning star indicates that the price of the currency will welcome a round of rising market.
In this chapter, we will learn the application of candlestick patterns together with Ah Yue, today sharing bullish candlestick combinations.
The night is about to pass, a beautiful day is about to begin, the appearance of the morning star indicates that the price of the currency will welcome a round of rising market. What kind of candlestick combination constitutes a morning star? As shown in the red lines in the figure below.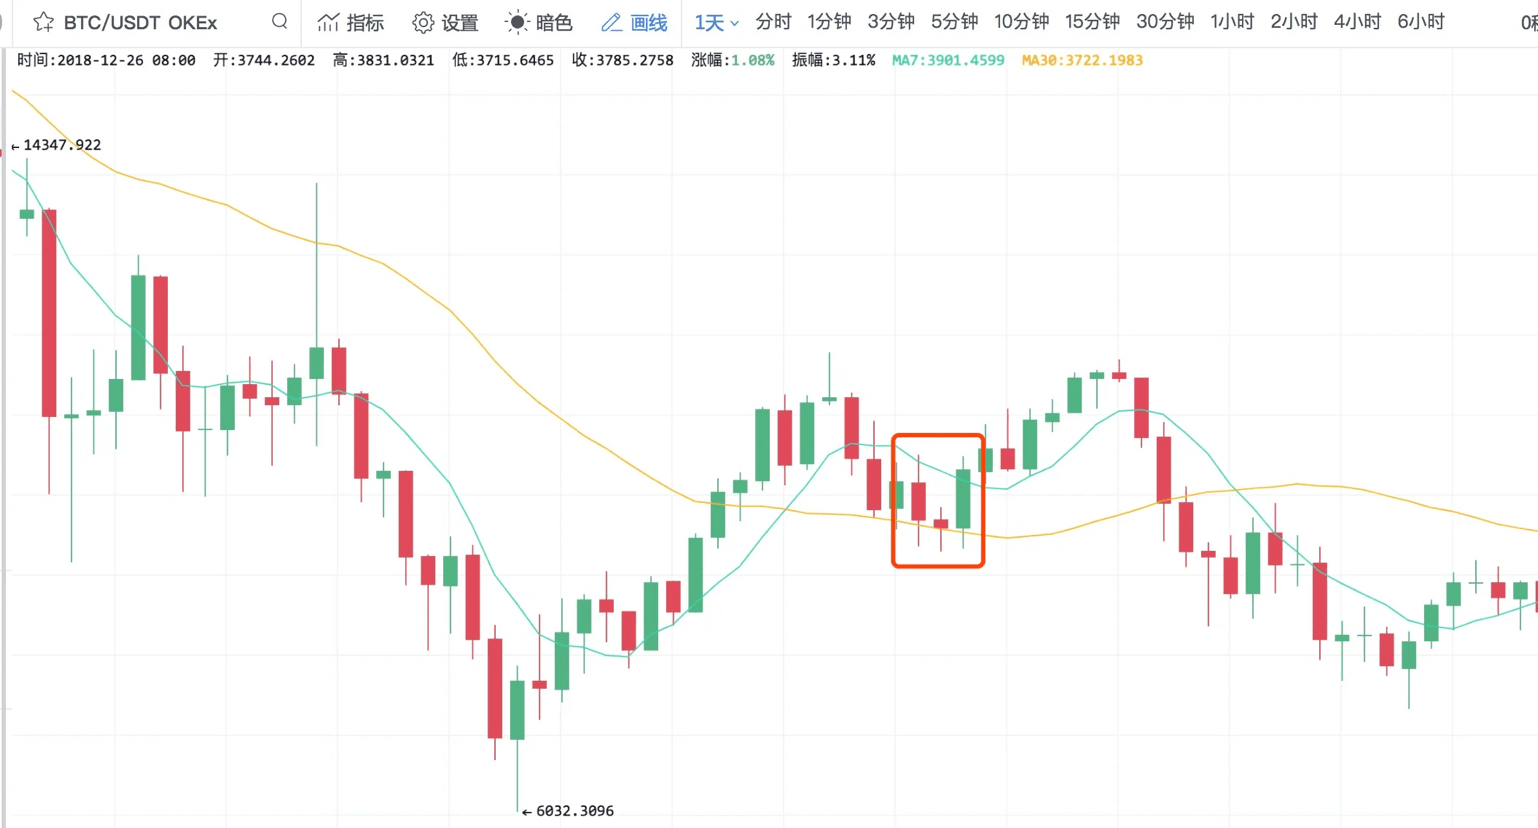
(BTC/USDT daily chart)
The standard morning star is composed of three candlesticks: first a larger bearish candle, followed by a candle resembling a 'cross', and the third candlestick is a larger bullish candle.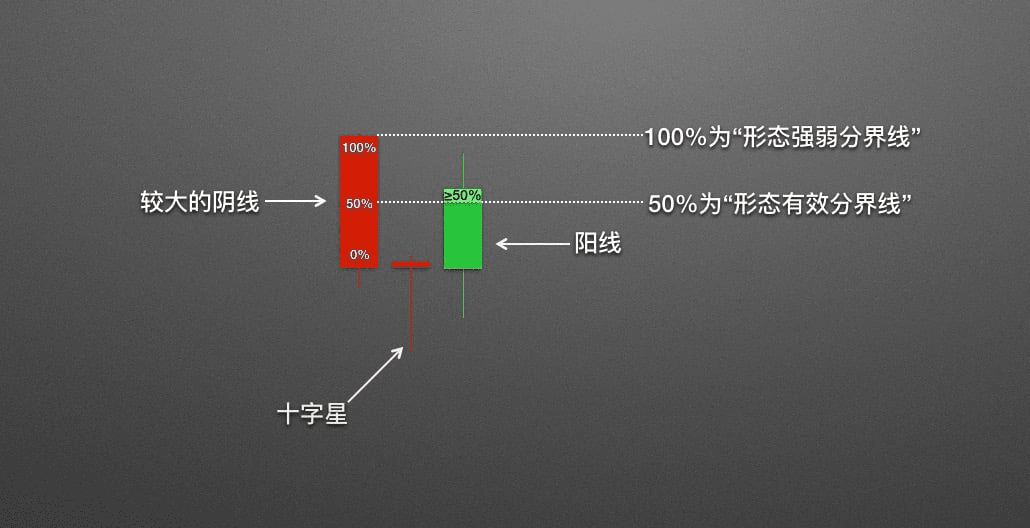
(Standard morning star)
For the morning star to be valid, there are clear requirements for the length of the third bullish candle; its closing price must be above the 50% level of the first bearish candle's body.
After confirming the morning star is valid, we can also determine the strength of the bullish sentiment by the closing price of the third bullish candle.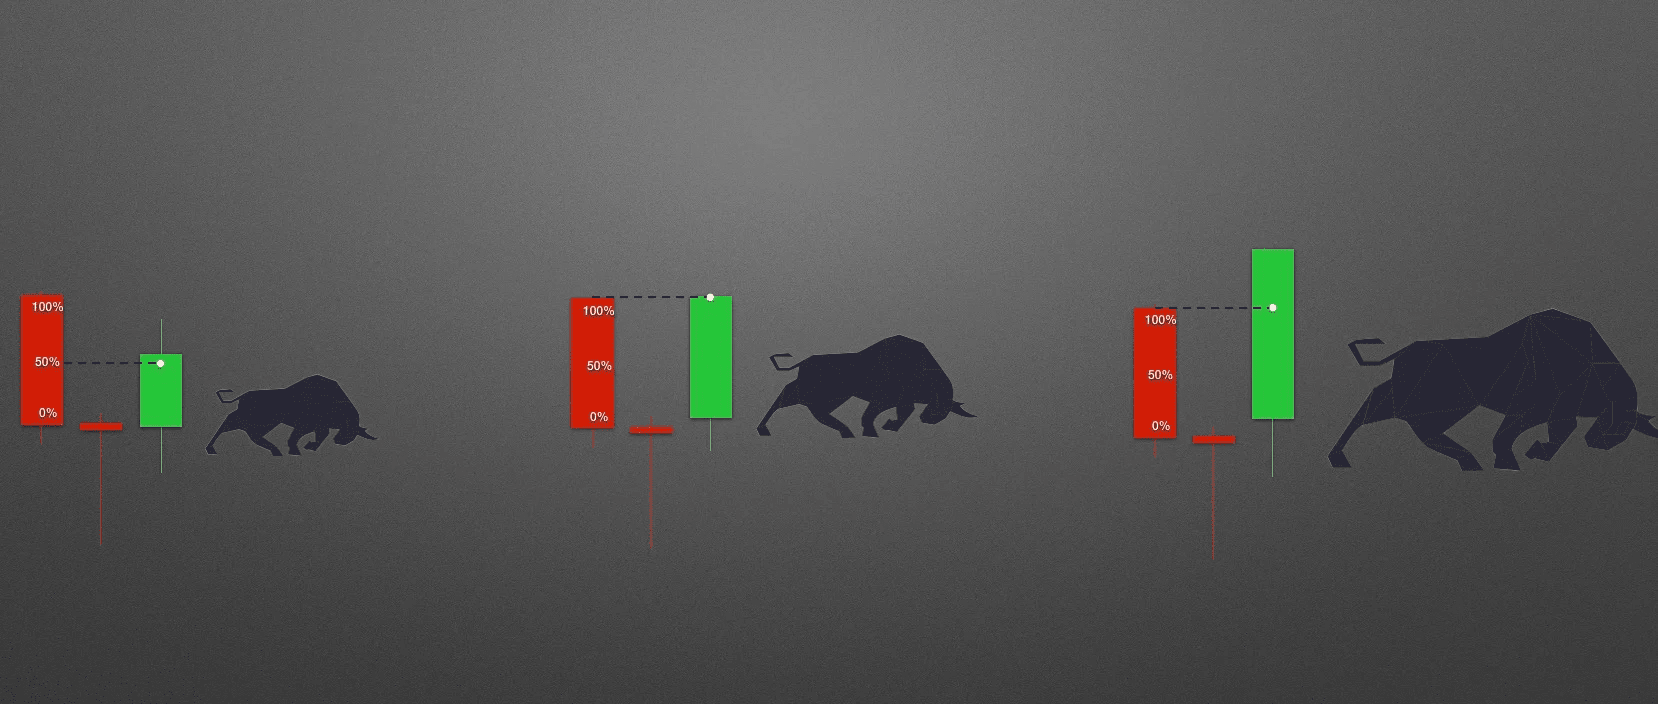
(Bullish strength increases sequentially)
As shown in the figure, if the closing price of the bullish candle just exceeds the 50% pass line, then the bullish strength in this case is relatively weak. If the closing price of the following bullish candle matches the opening price of the preceding bearish candle, it is considered strong bullish strength. If the closing price of the following bullish candle is significantly higher than the opening price of the preceding bearish candle, the bullish strength is even stronger.
What has just been discussed is the most standard morning star pattern, but in actual movements, the morning star may have some variations. So what does a real morning star look like in the market?
(Real 'morning star' in the market)
For example, the three types of morning stars shown in the illustration: the left morning star does not resemble a 'cross' star, but rather looks more like a 'T' line. We will restore it to the real price chart.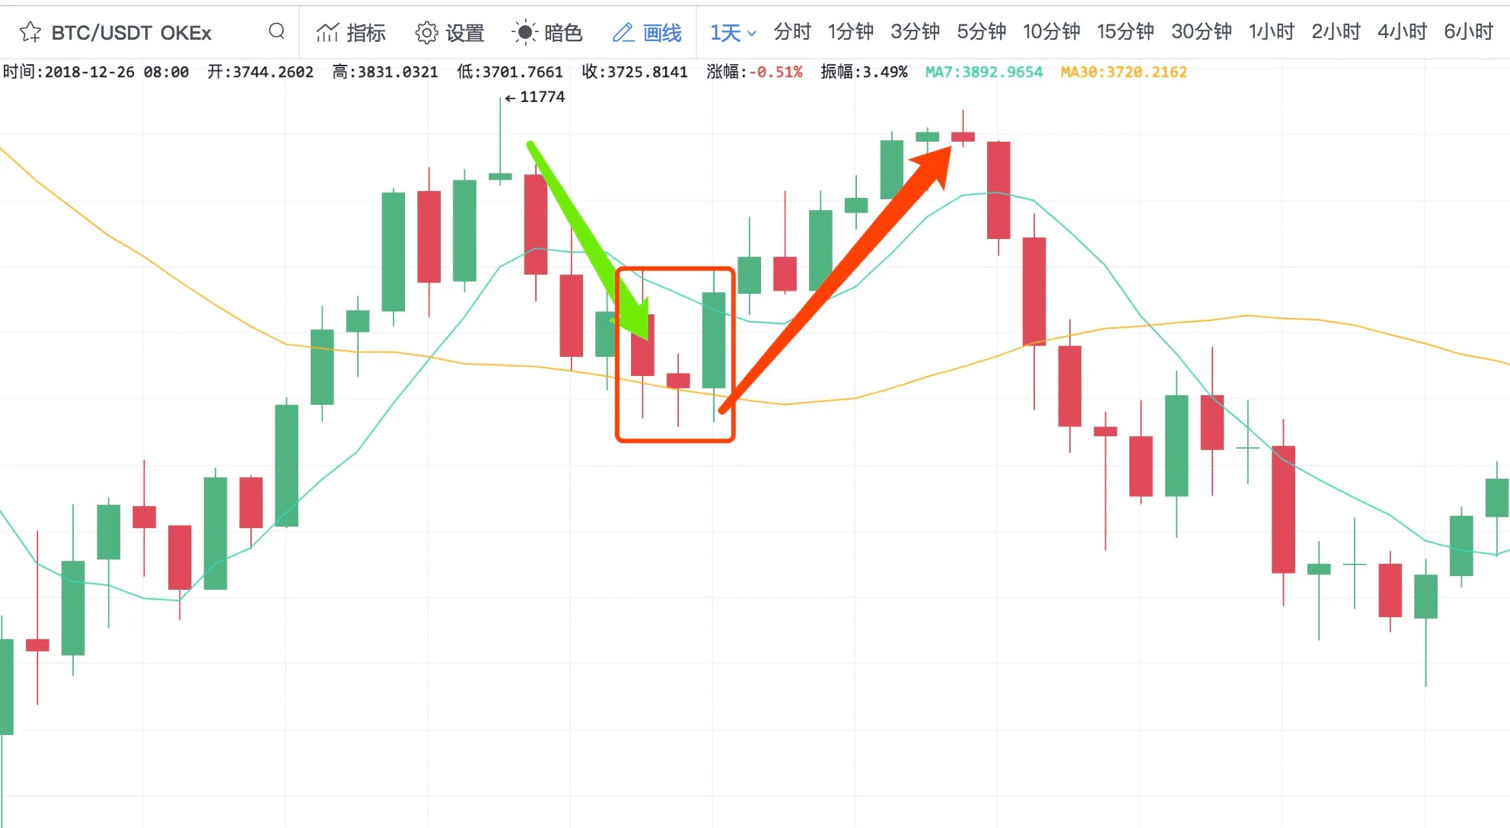
(Real price chart 1)
After a sharp decline in price, a morning star appears, and the price rebounds in the market.
(Real 'morning star' in the market)
As shown in the above diagram, the middle morning star is composed of two small candles.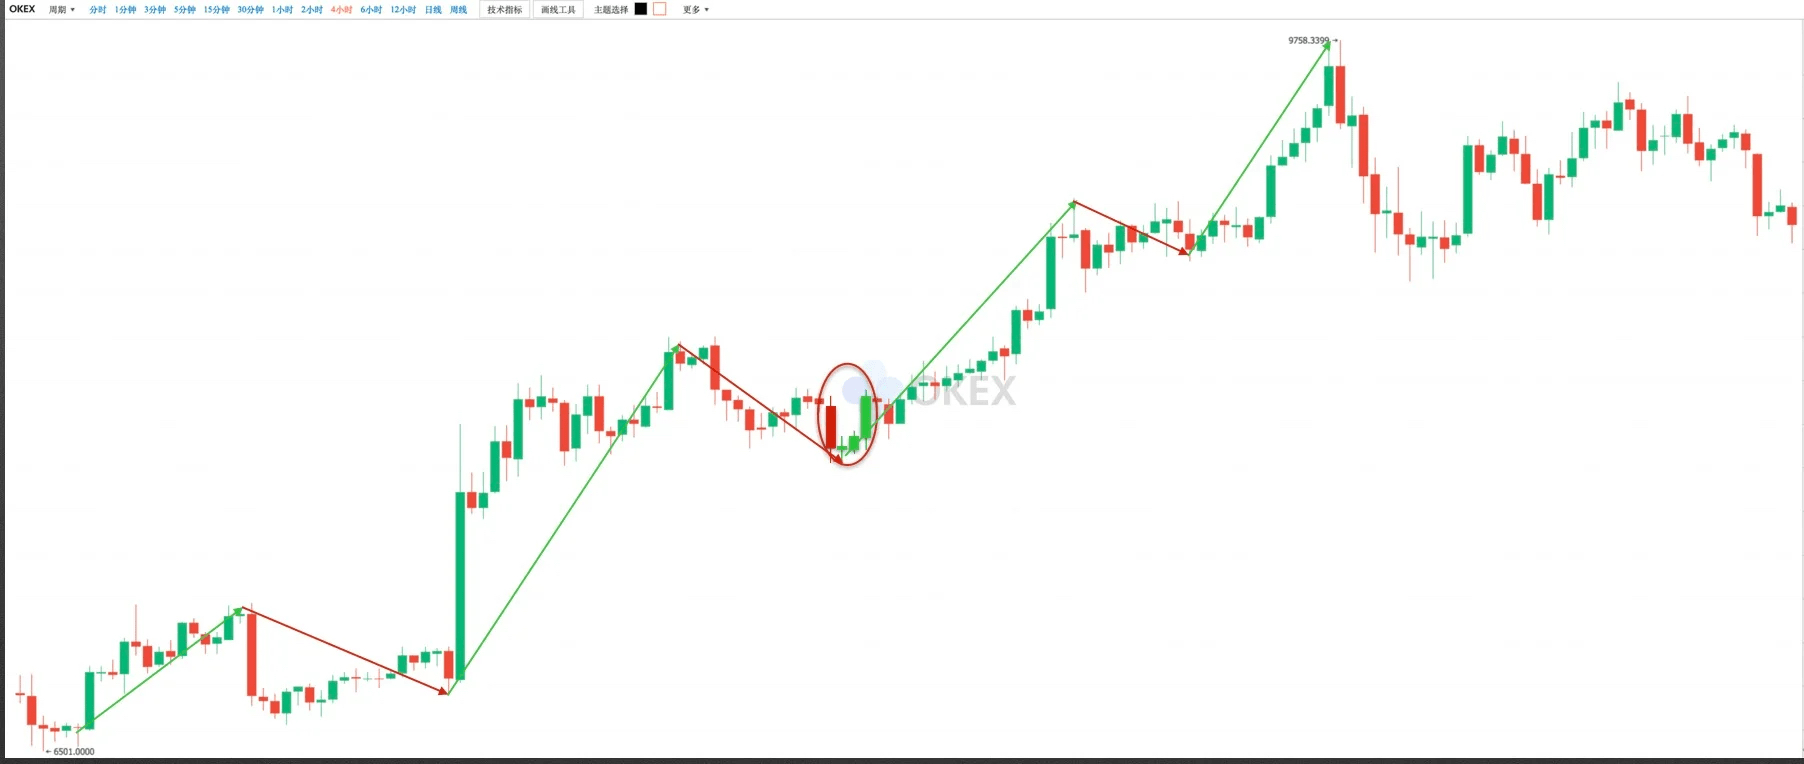
(Real price chart 2)
The price of the currency forms a morning star during the upward movement, and the price continues to rise.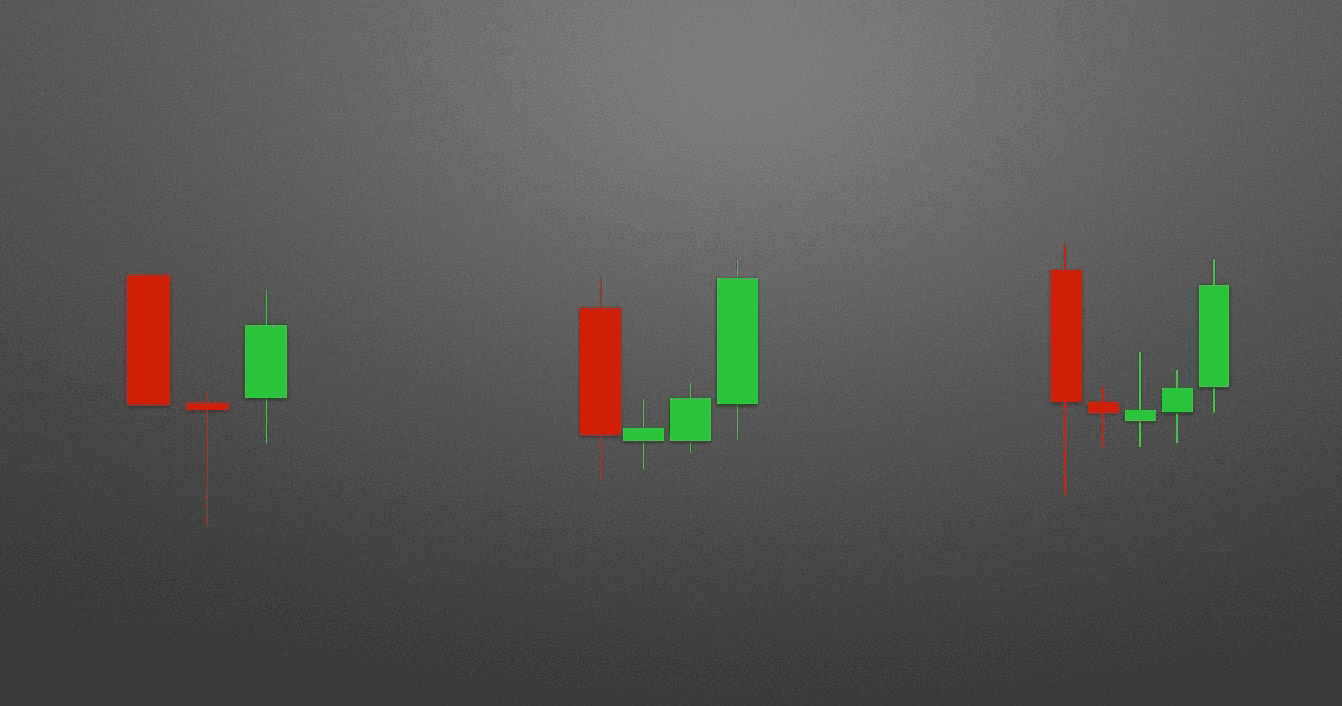
(Real 'morning star' in the market)
In the above figure, the far-right morning star is composed of three small candles or star candles.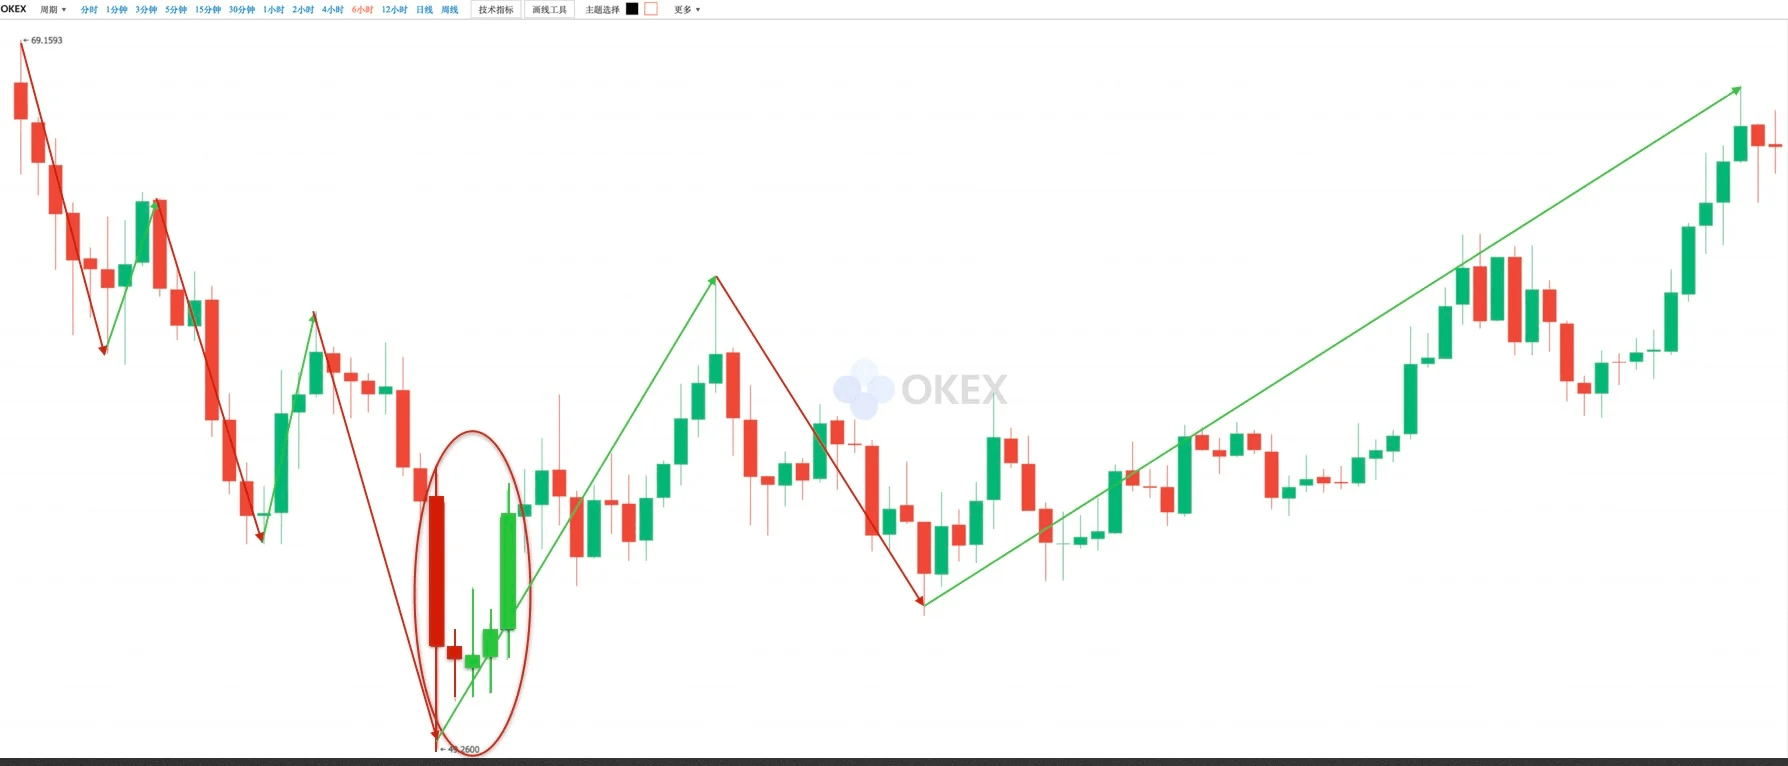
(Real price chart 3)
The price of the currency drops sharply, forming a morning star, and then the price stops falling and reverses.
Next, we will learn the second type of bullish candlestick pattern—bullish engulfing.
First, let's look at the characteristics of the bullish engulfing. The following bullish candle's body completely covers the preceding bearish candle's body, as if the bearish candle is being engulfed by the bullish candle, indicating that the bullish forces are making a strong comeback. Hence the name bullish engulfing.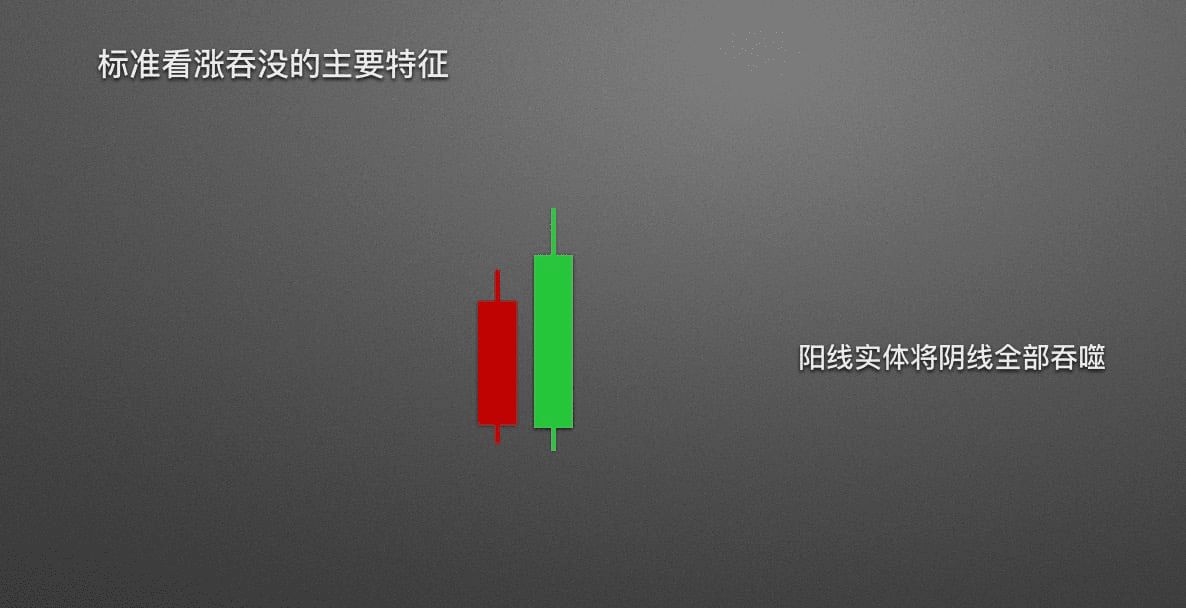
(Bullish engulfing)
How to determine the strength of the bullish sentiment?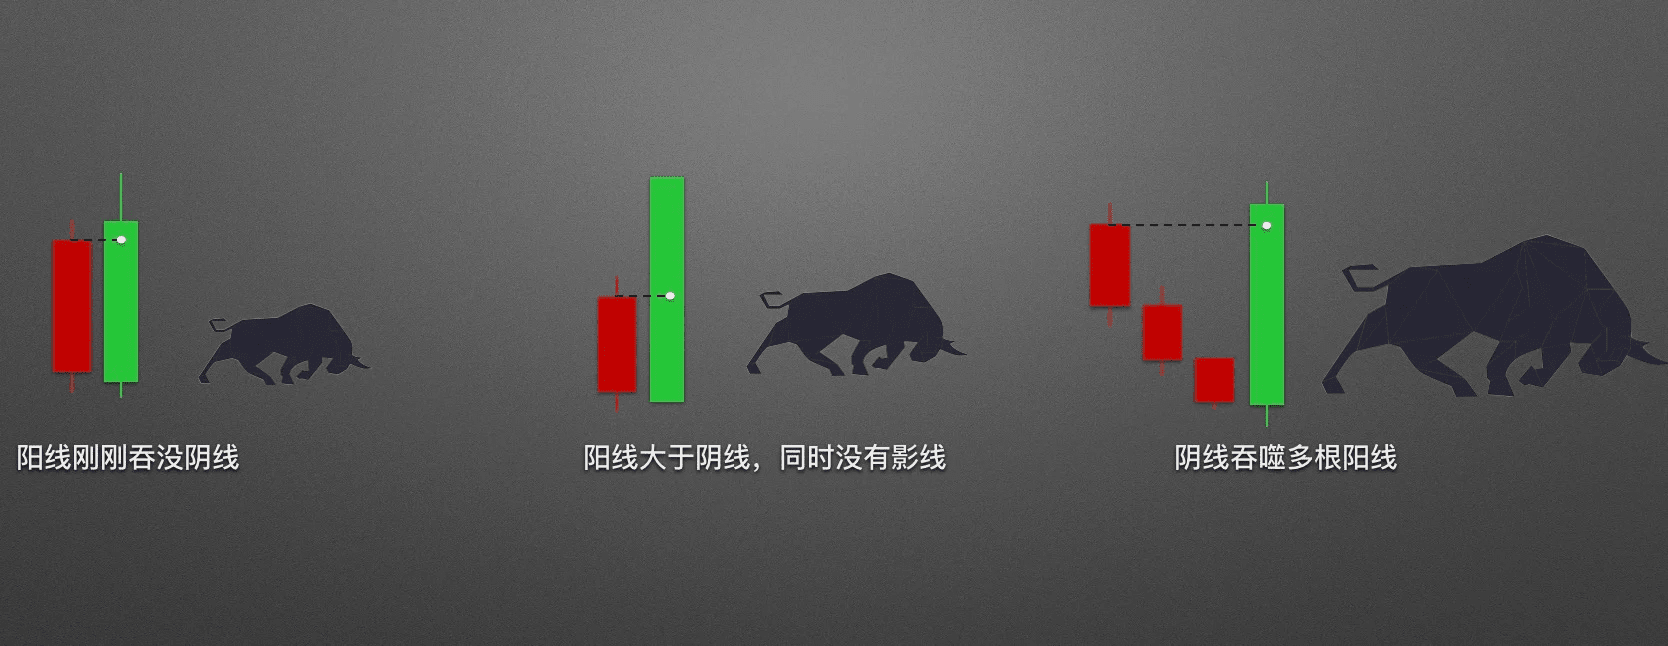
(Bullish strength increases sequentially)
On the far left, the bullish candle's body just engulfs the preceding bearish candle's body, this combination has the weakest bullish strength; in the middle, the bullish candle's body is significantly higher than the preceding bearish candle's body, even reaching twice the size of the previous bearish candle, this combination has strong bullish strength; on the right, the bullish candle's body completely engulfs multiple preceding bearish candles, this combination has the strongest bullish strength.
In the market, there are many non-standard bullish engulfing combinations. So what does a real 'bullish engulfing' look like?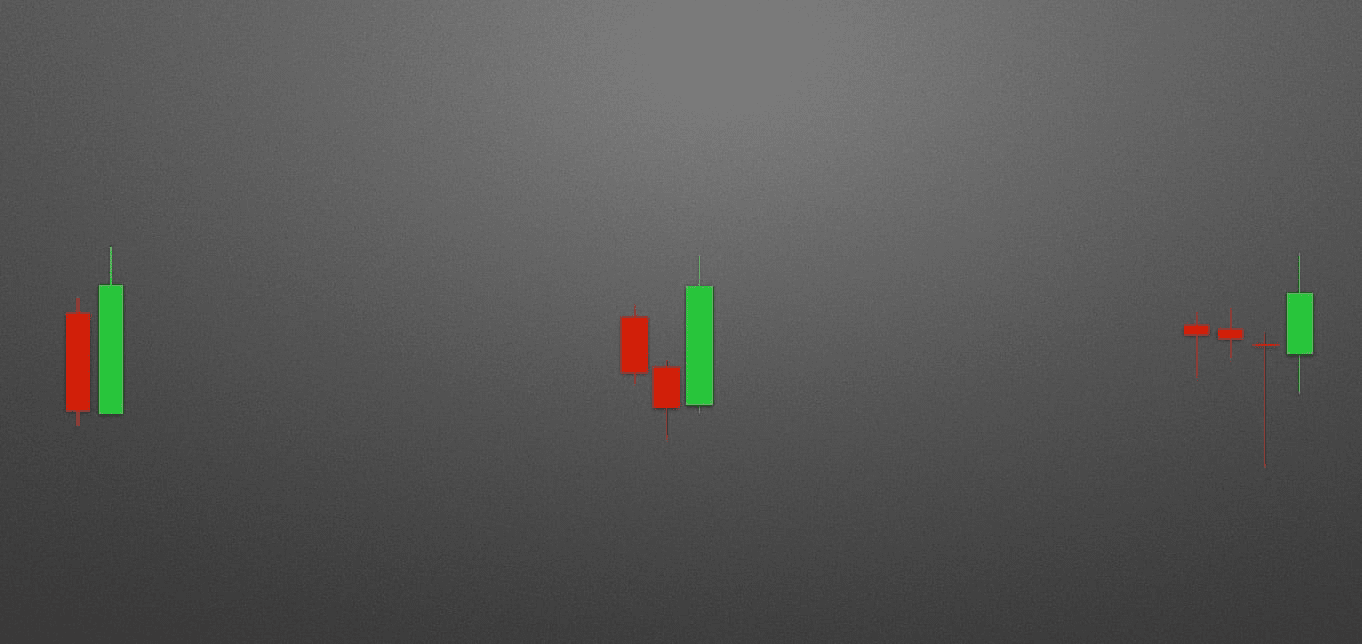
(Real bullish engulfing in the market)
For example, the three types of bullish engulfing combinations shown in the figure: the bullish candle does not need to completely engulf the shadow part of the preceding bearish candle.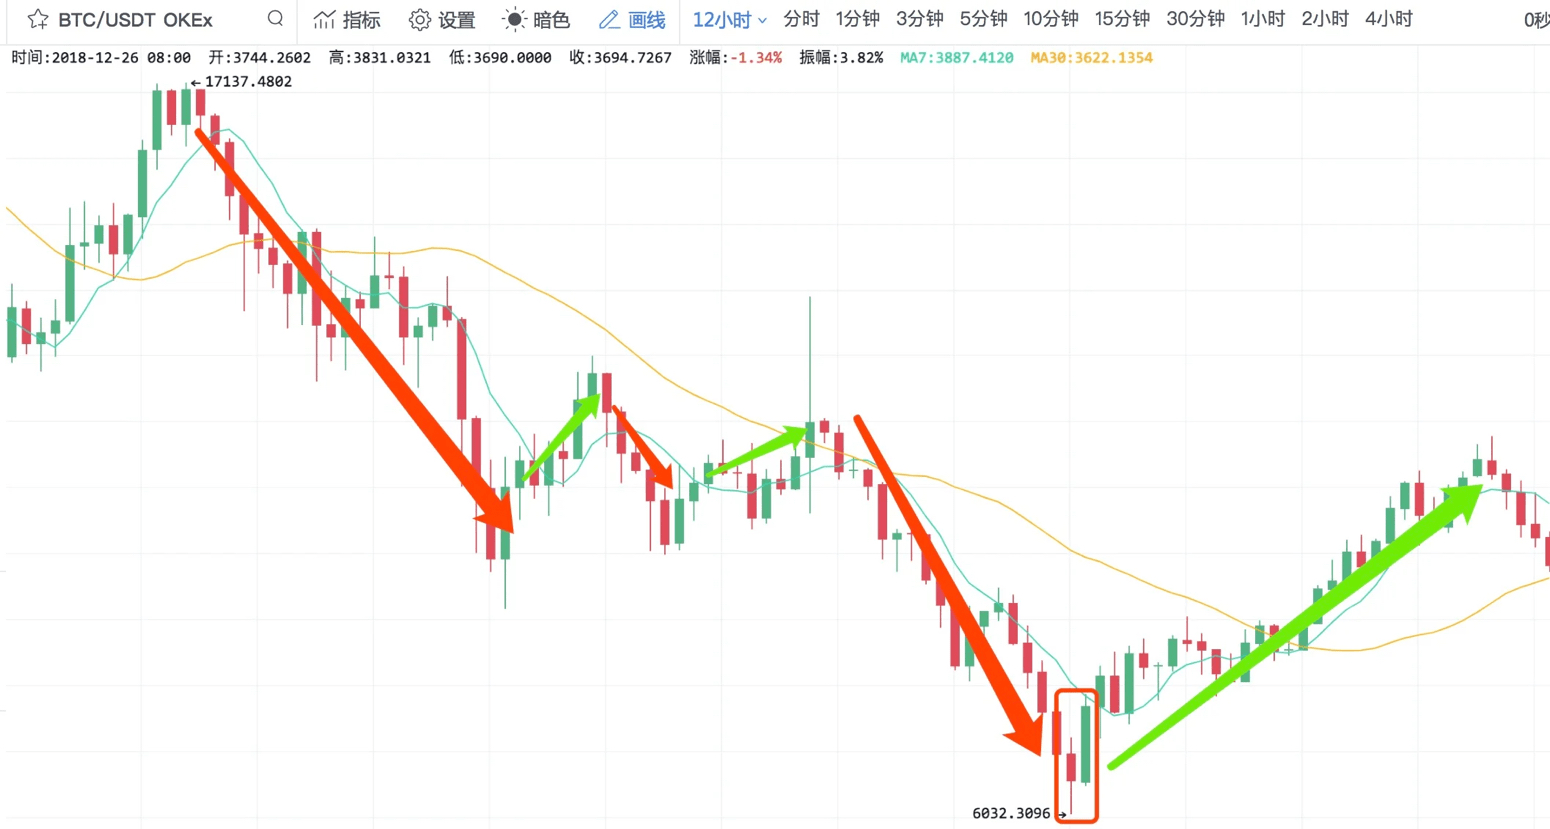
(Real price chart 1)
As shown above, after a sharp decline in price, a bullish engulfing pattern appears, followed by a significant rebound in the market.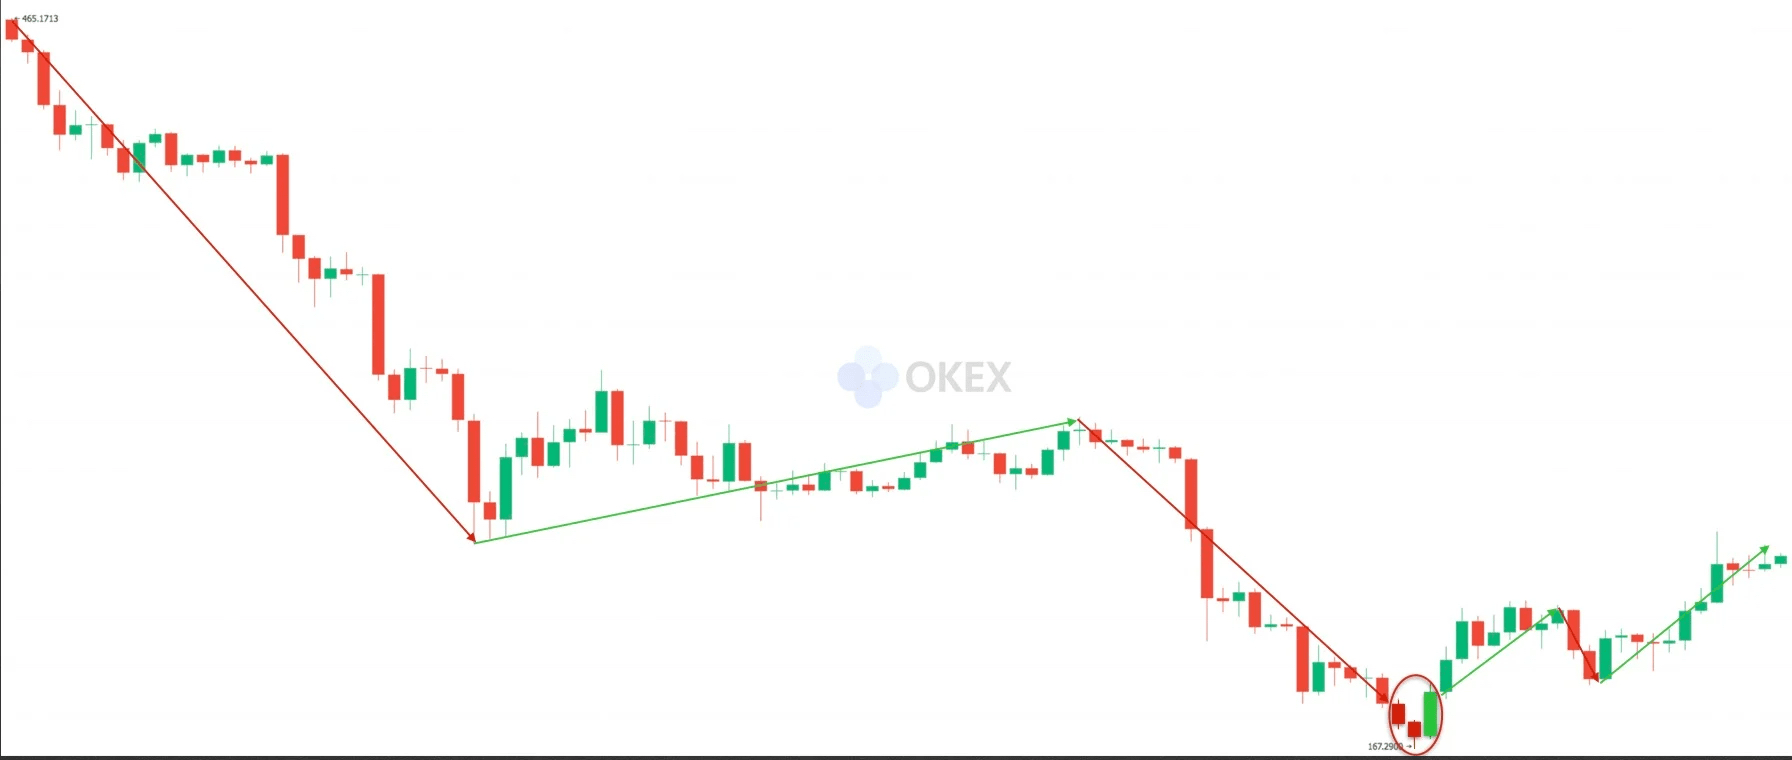
(Real price chart 2)
A large bullish candle engulfs two small bearish candles, forming a bullish engulfing pattern, followed by an upward movement.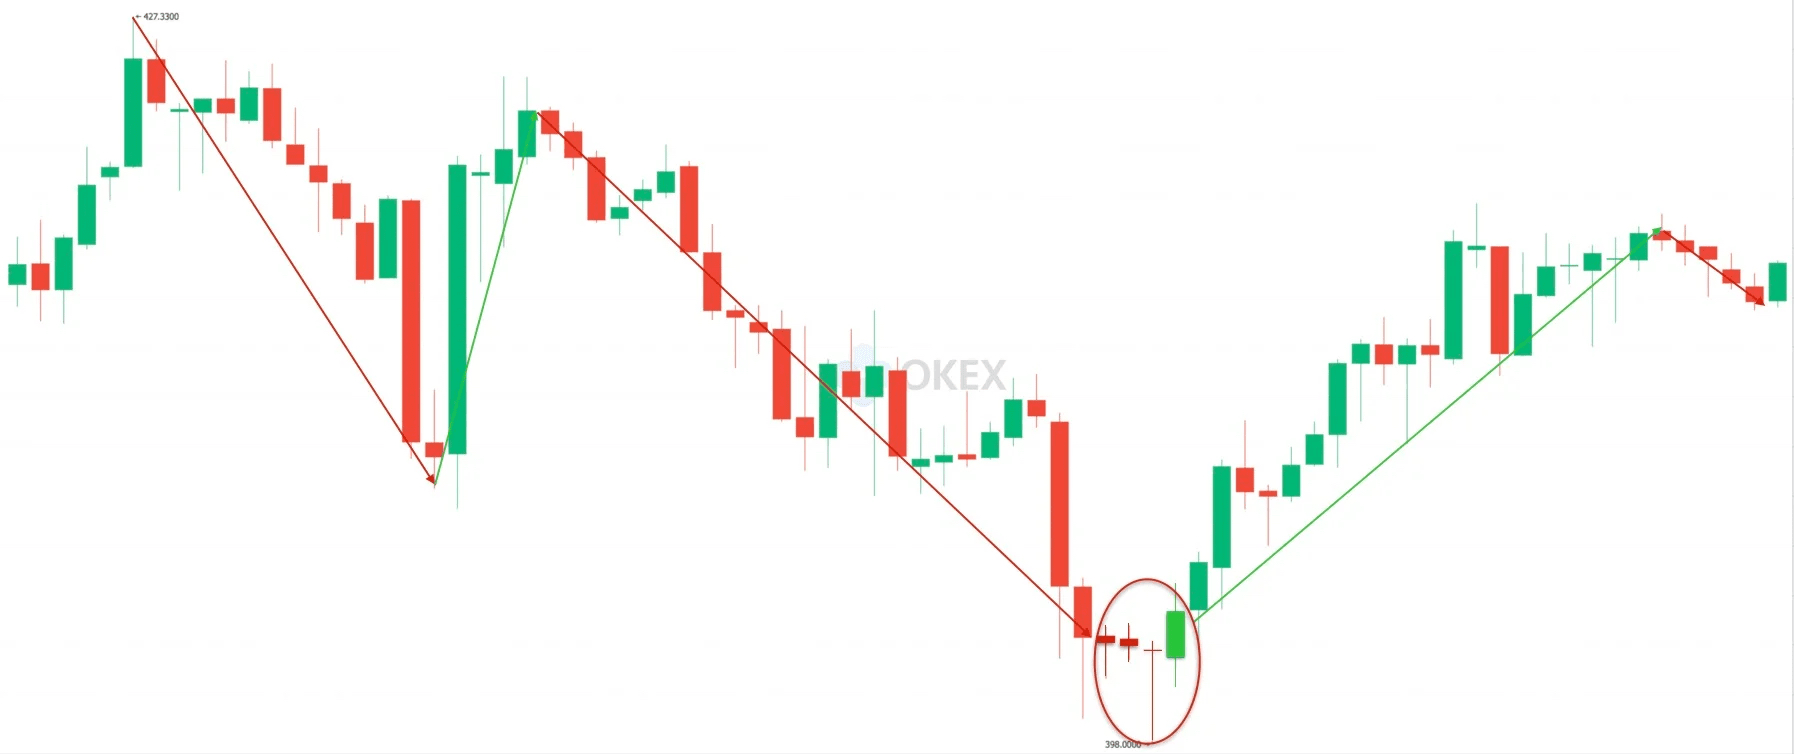
(Real price chart 3)
The bullish candle completely engulfs three bearish candles, followed by a significant rise in the market.
The third type of bullish candlestick pattern—tower bottom.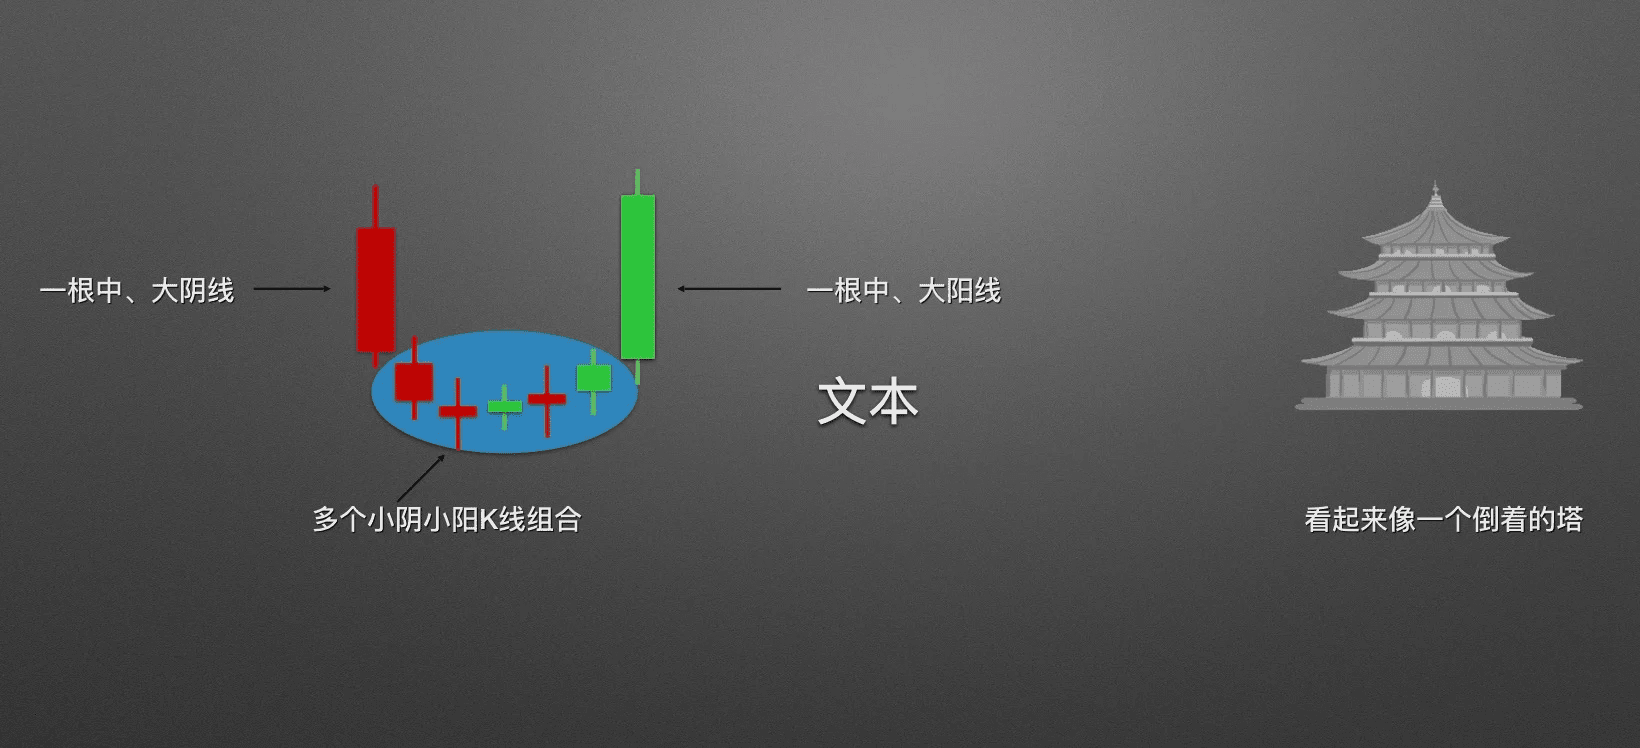
(Tower bottom)
Tower bottom, on the left is a medium bearish candle or a large bearish candle; the middle is made up of several small candles, usually more than five; on the right is a medium bullish candle or a large bullish candle. Overall, it looks like an upside-down pagoda, hence the name tower bottom.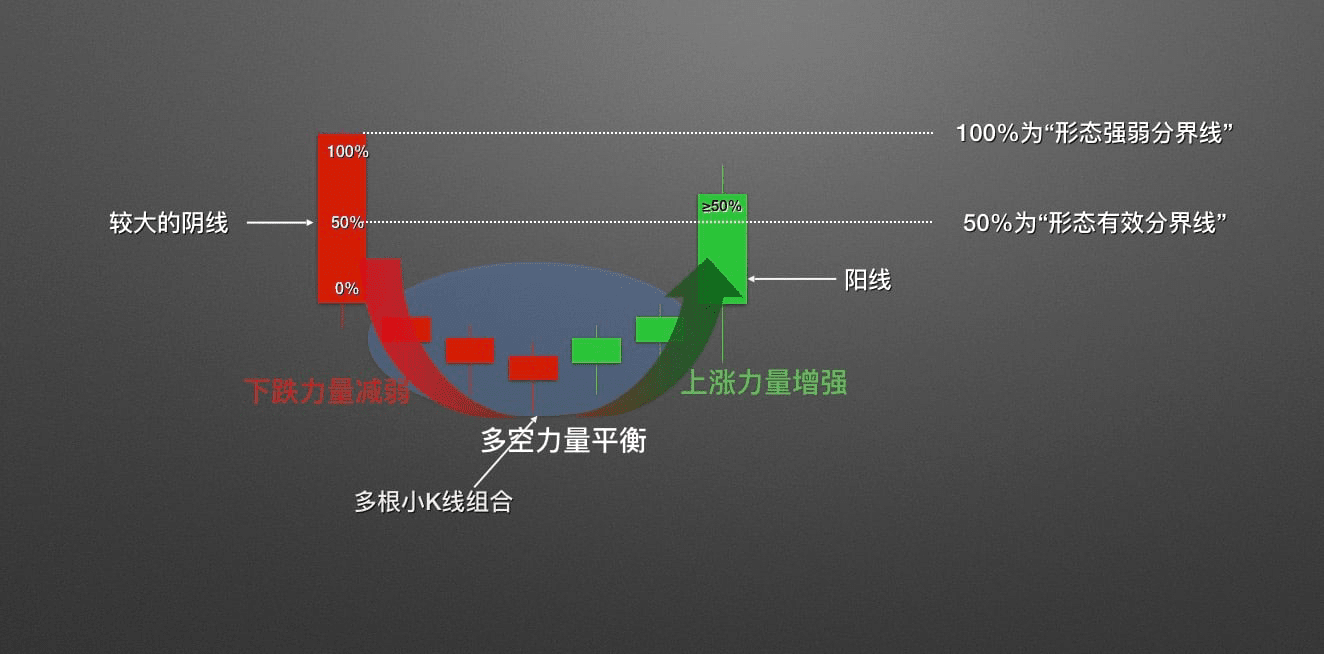
(A standard tower bottom)
An effective tower bottom must meet: the closing price of the last bullish candle must exceed 50% of the preceding large bearish candle's body. The tower bottom shows that the short-selling forces are gradually weakening, leading to a balance of long and short forces, and finally an increase in bullish strength.
After confirming that the tower bottom is valid, we can also determine the strength of the bullish sentiment by the position of the closing price of the last bullish candle.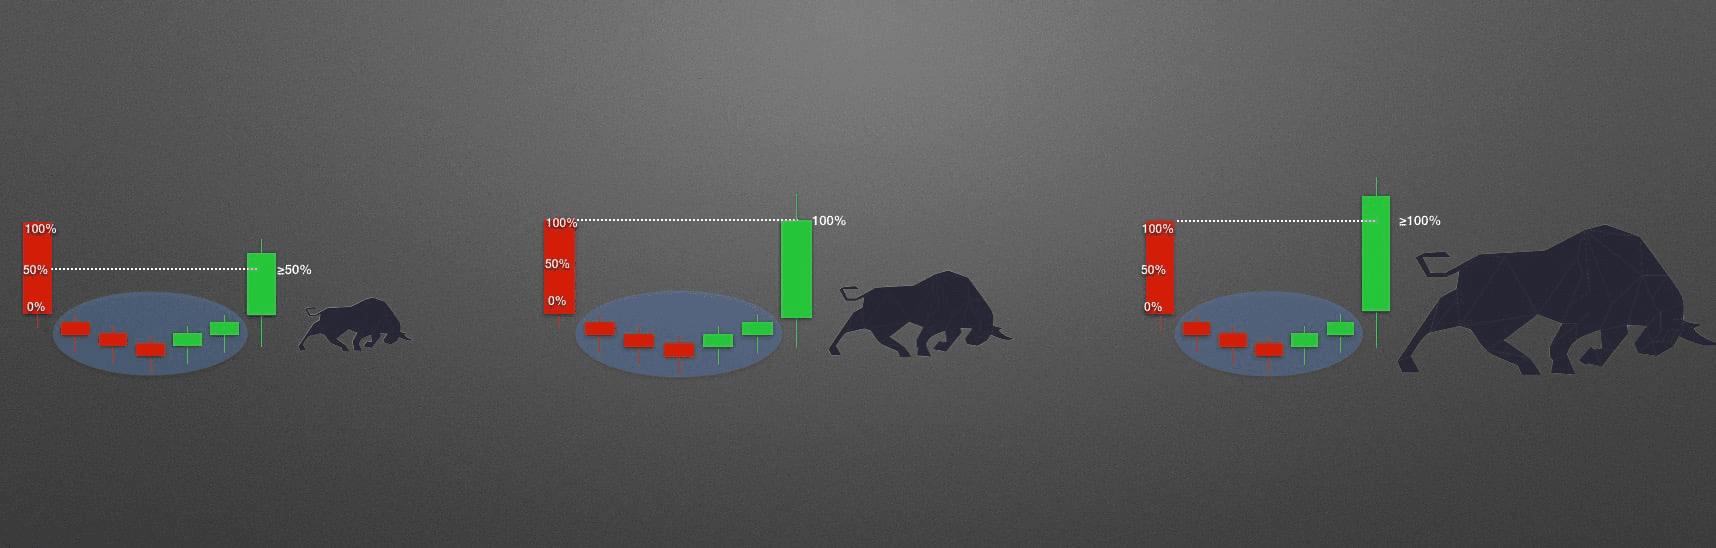
(Bullish strength increases sequentially)
As seen in the figure, if the closing price of the bullish candle just exceeds the 50% pass line, then the bullish strength in this case is relatively weak. If the closing price of the following bullish candle matches the opening price of the preceding bearish candle, it is considered strong bullish strength. If the closing price of the following bullish candle is significantly higher than the opening price of the preceding bearish candle, the bullish strength is even stronger.
Of course, in actual price movements, the tower bottom is not as perfect as shown in our schematic diagram. So, we need to be flexible. Let's see how the actual 'tower bottom' in the market looks.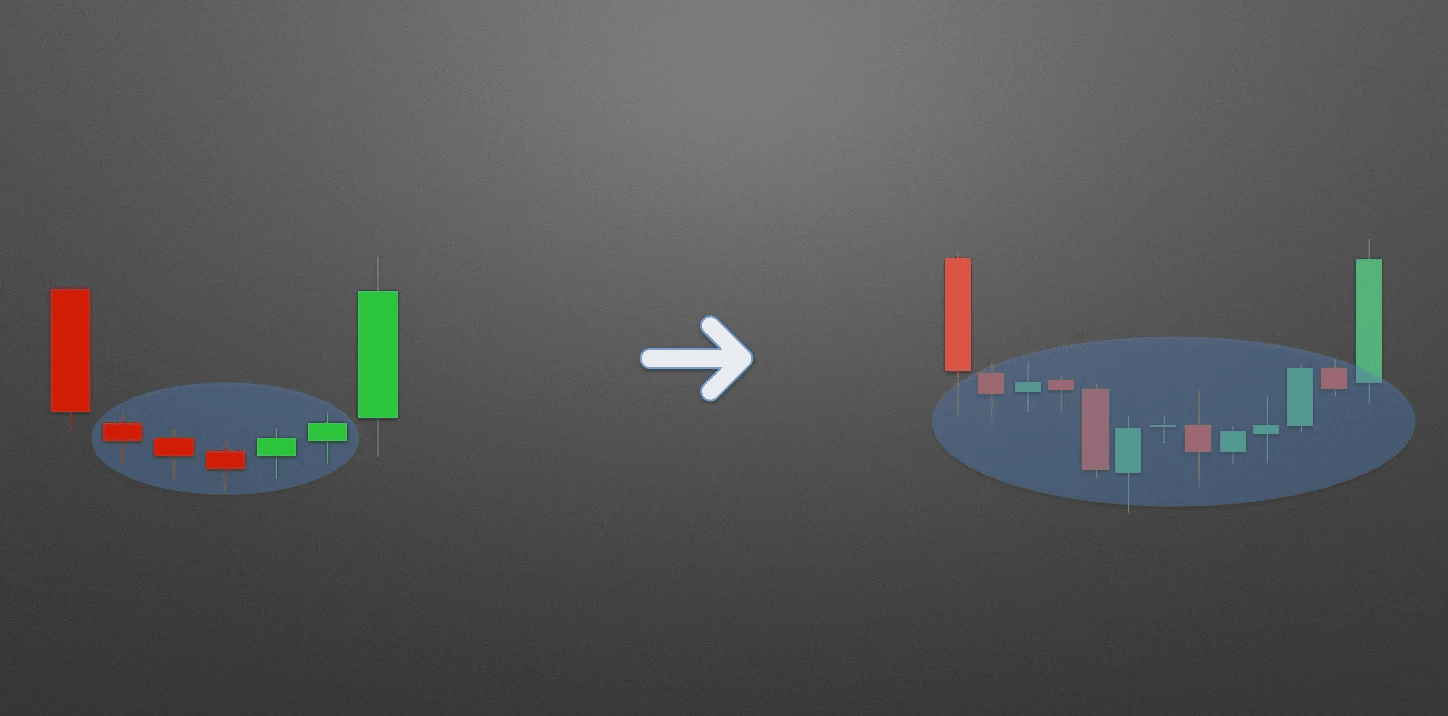
Change one, the actual appearance is very close to the schematic diagram of the tower bottom.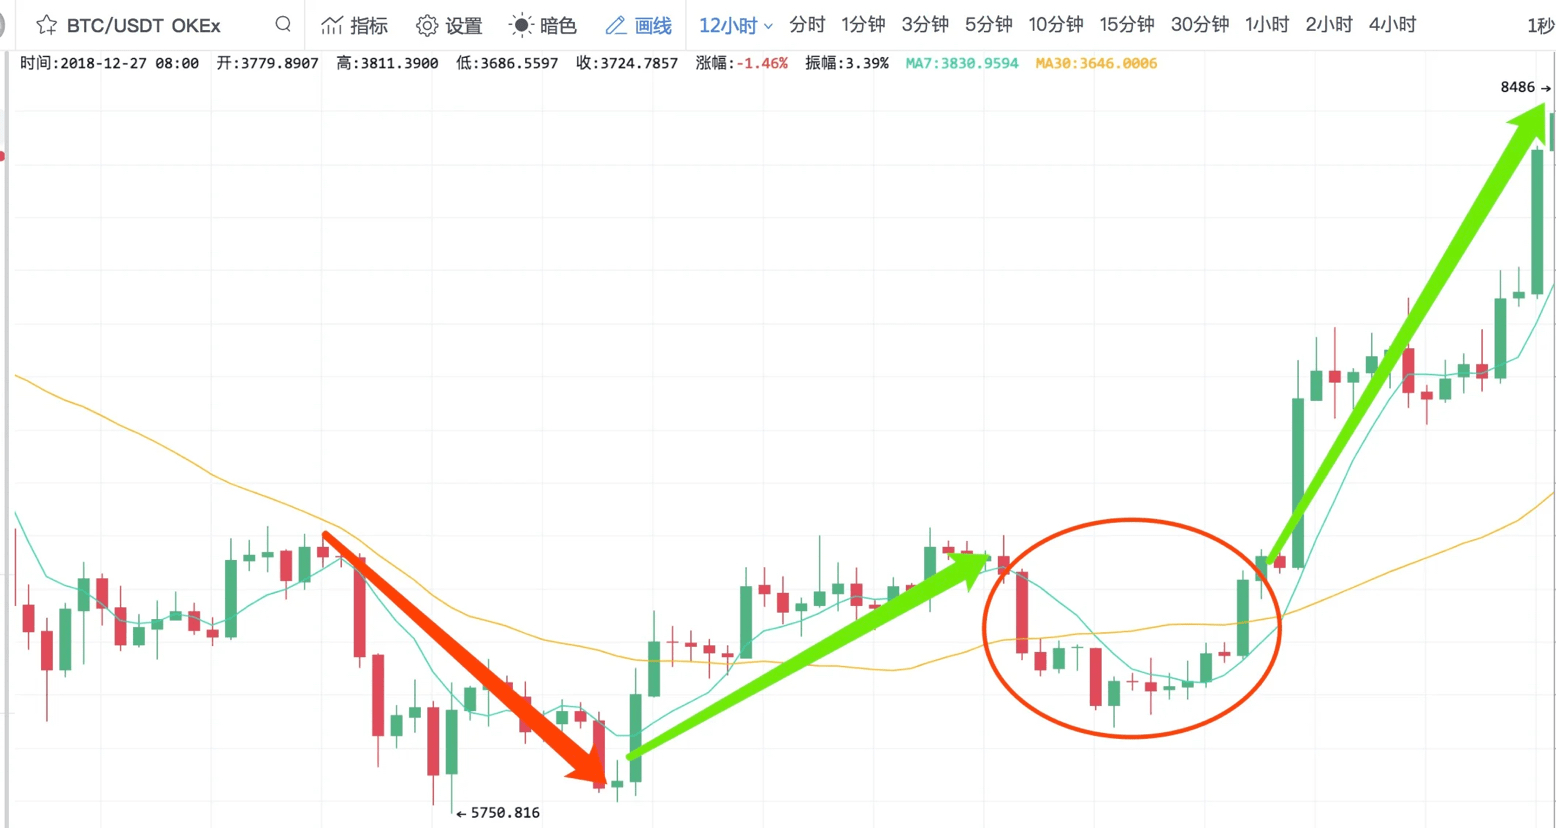
(BTC/USDT 12-hour chart)
As shown above, the tower bottom appears in an upward trend, once again establishing the advantage of rising, followed by a clever upward trend.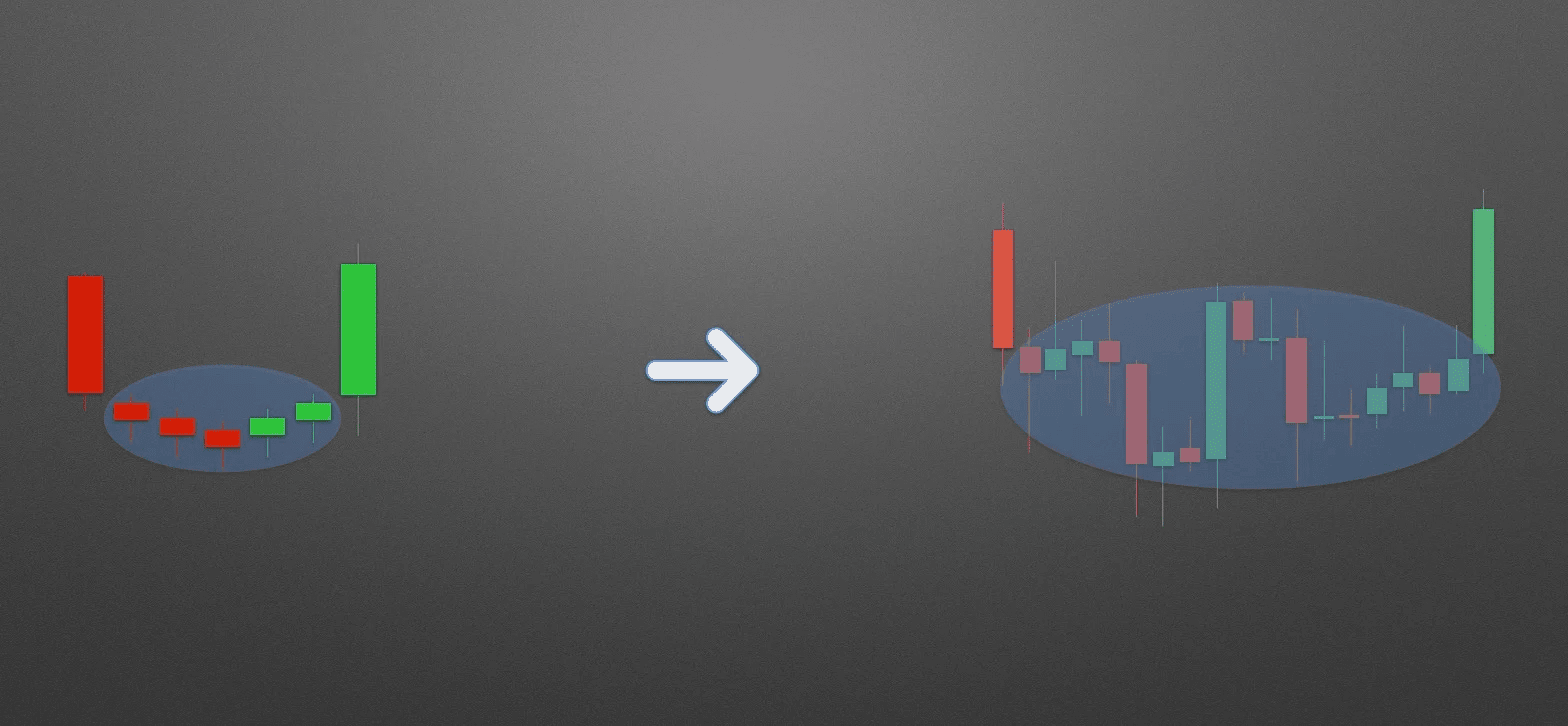
Change two, the middle part of the tower bottom is not composed entirely of very small candles, but rather has larger fluctuations.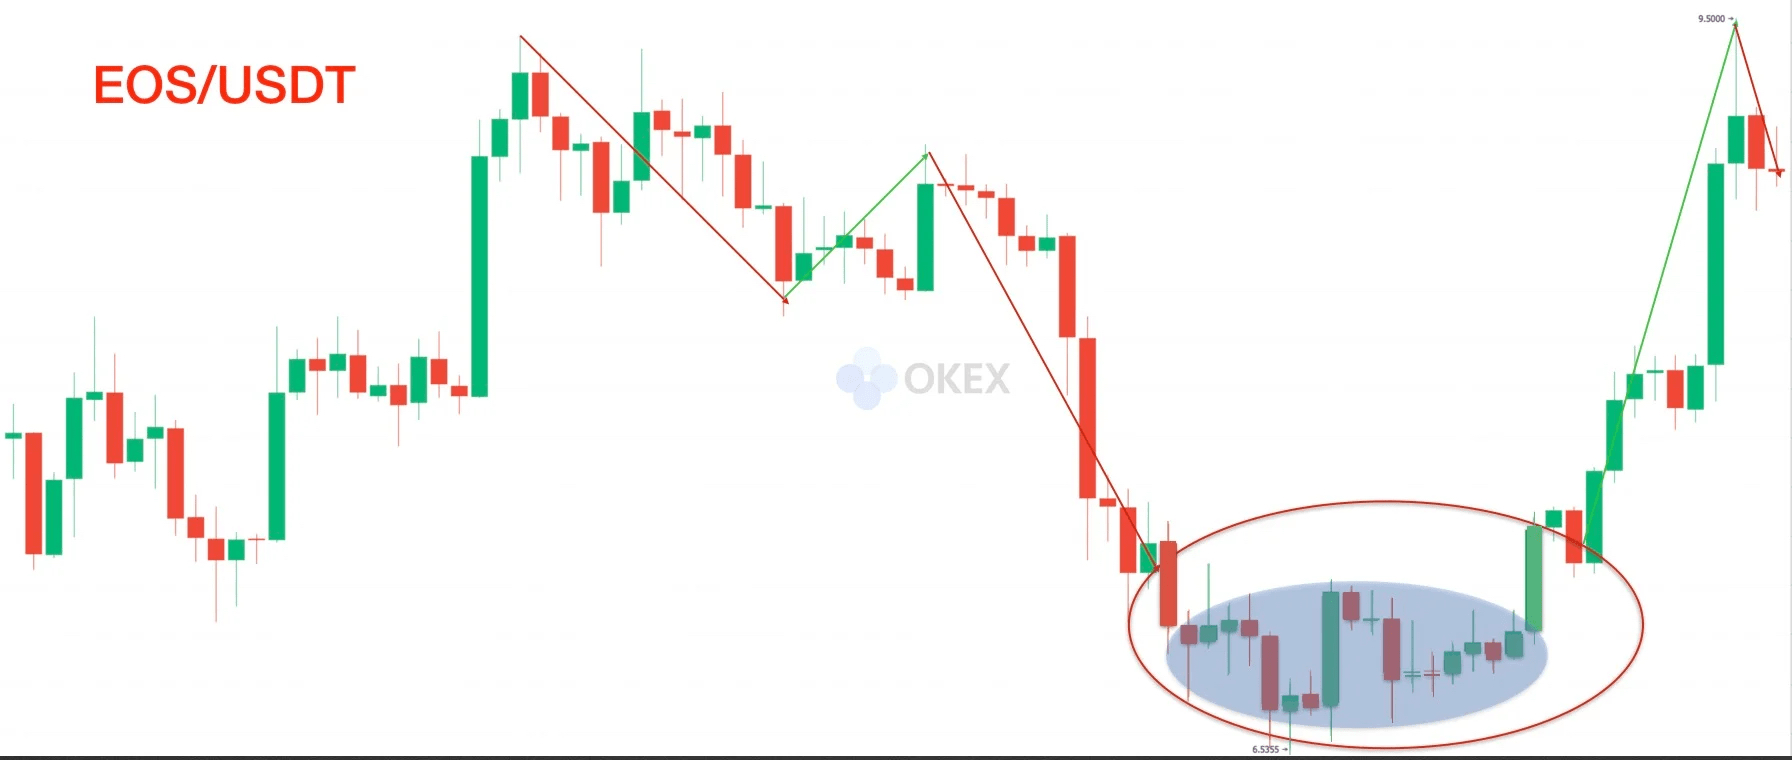
(EOS/USDT 6-hour chart)
As shown above: After a sharp drop in price, a tower bottom forms, and the price stops falling and reverses.
Finally, let's review the content of this episode.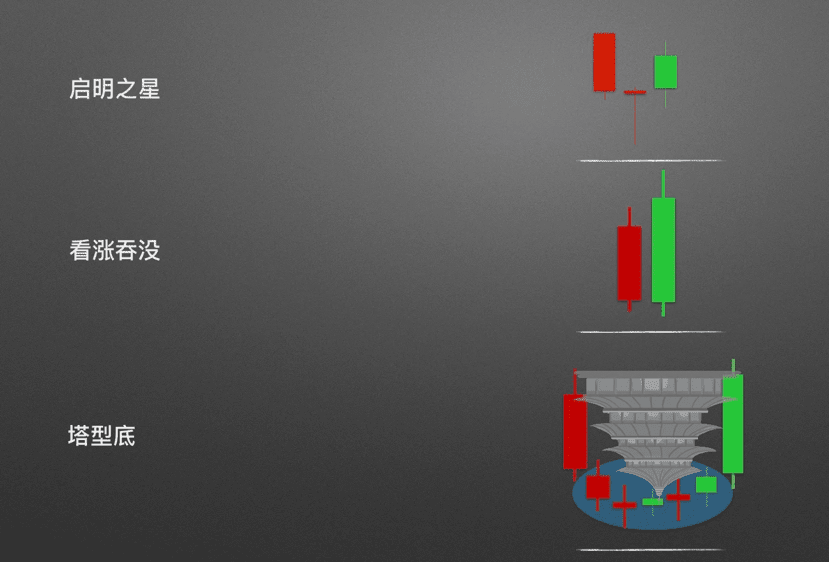
(3 types of bullish candlestick patterns)
Three typical bullish candlestick patterns. The first, the morning star, indicates brightness; the second, the bullish engulfing, where bearish forces are quickly suppressed by bullish forces; the third, the tower bottom, where bullish power steadily advances.
I am Ah Yue, focusing on analysis and teaching, a mentor and friend on your investment journey! I hope everyone investing in the market can have smooth sailing. As an analyst, the most basic thing is to help everyone make money. I will help you solve confusion, manage positions, and provide operational advice. When you are lost and don’t know what to do, look at Ah Yue (homepage), Ah Yue will point you in the right direction$BTC #币安HODLer空投ERA
