
Ripple's native token, XRP, is showing signs of recovery. After several weeks of sideways trading, XRP surged from $2.10 to over $3.00 in less than two weeks. This explosive move is attracting new attention as traders look for altcoins that can keep pace with Bitcoin's recent highs.
The daily chart of XRP/USD shows a breakout from the range of $2.40–$2.50, with the price currently consolidating near $2.93. The EMA 9 (orange) and EMA 21 (green) indicate a strong upward slope — a clear signal of strong bullish momentum.
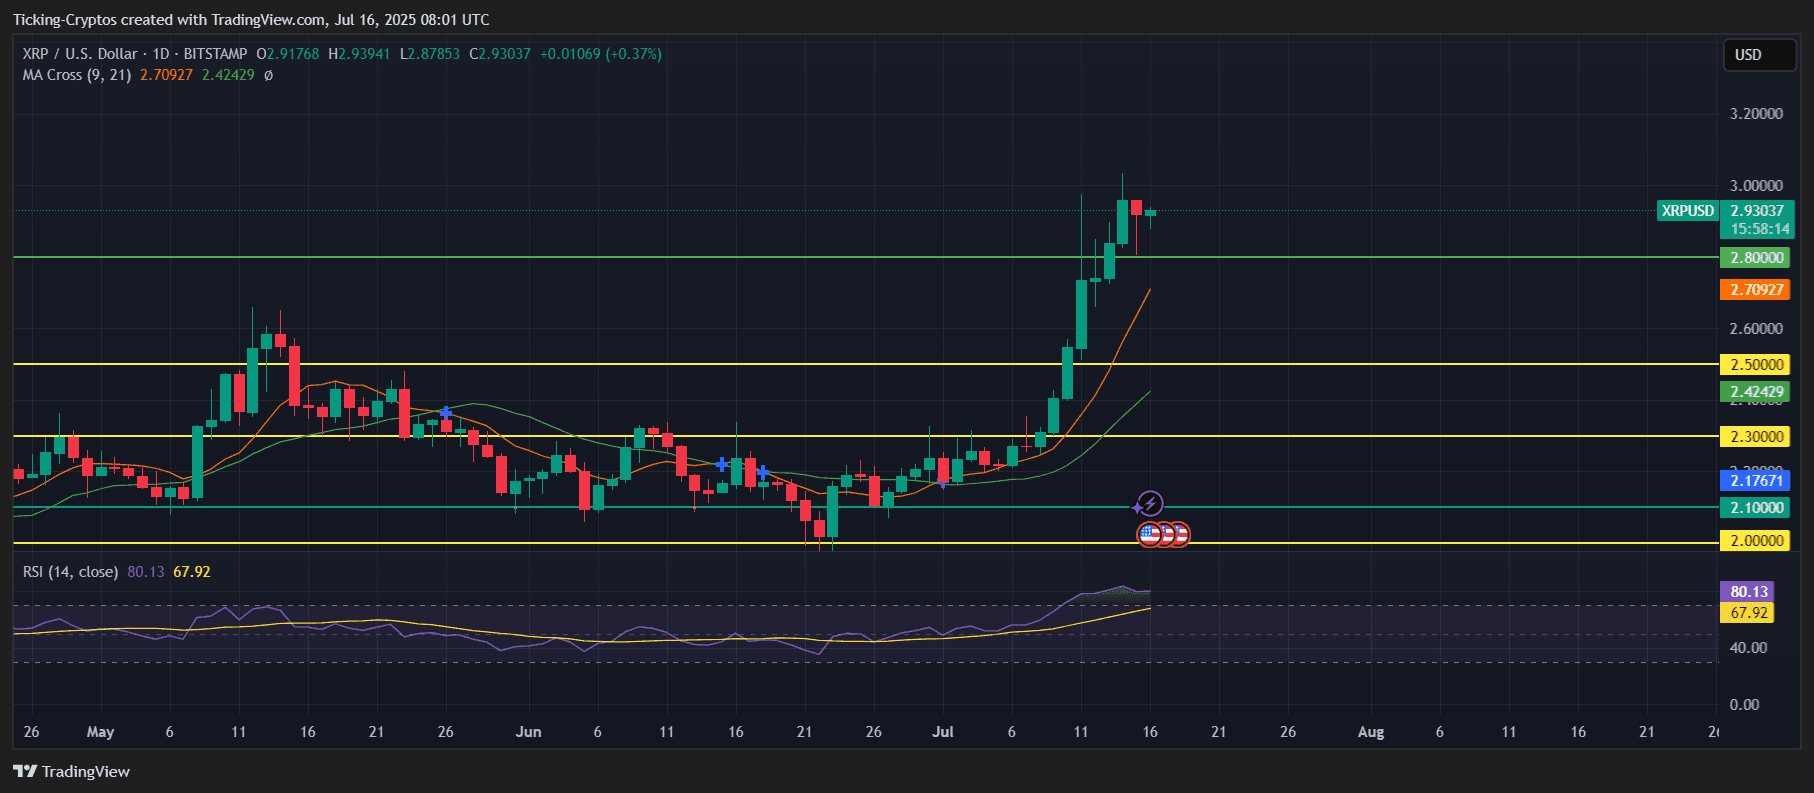
Current support level: $2.80
Next resistance level: $3.20
EMA crossover: Bullish signal confirmed
RSI: At 80.13 – deep in overbought territory
Although the RSI indicator is in the overbought zone, XRP remains steady. This indicates strong demand and optimistic sentiment, but also raises the possibility of short-term correction or consolidation.
XRP News and Fundamentals Under Spotlight
Recent legal developments are favoring Ripple, boosting investor sentiment. Additionally, XRP's increasing adoption in payment and cross-border remittance transactions is reinforcing its practical application. The biggest momentum comes from President Trump recently supporting cryptocurrencies in the United States, facilitating Ripple's position as an American company.
XRP Price Prediction: Is the $4 Price Realistic?
Bullish scenario: If XRP can maintain above $2.80, the next target will be $3.20, followed by $3.50 in the coming weeks. The $4 level is still uncertain at this time.
Bearish scenario: Failing to hold the $2.80 level could lead to a retest of the $2.50 level.
Sideways scenario: Merging between $2.80 and $3.00 as RSI cools down.
Overall, the upward trend remains intact as long as XRP does not drop below $2.70.
