I have been trading cryptocurrencies for over 10 years. In the first three years, I consistently incurred heavy losses and was 3 million in debt. After self-adjustment, I achieved financial freedom in the last 7 years, with stable compound interest, a monthly income in the seven figures, and an annual income in the eight figures!
Success is by no means accidental. Every successful person has gone through numerous trials and walked step by step. It cannot be denied that some people are born geniuses, but such individuals are extremely rare, neither you nor I are one of them. Most people, after experiencing continuous failures, gradually move towards perfection. It is precisely these experiences of failure that yield insights and lessons that one cannot gain through shortcuts.
A common saying is that there are no good opportunities. In reality, opportunities are reserved for those who are prepared. When opportunities arise, only those who are ready can firmly grasp them. Waiting passively like a hunter waiting for a rabbit will lead to missing out or failing to seize the opportunity when it truly appears.
In the cryptocurrency world, many friends may not know how to read K-line trading strategies, and those who do understand are few. As the saying goes, one trick can conquer everything. Mastering a technique that you can understand is not difficult; the challenge lies in the unwillingness to learn. Trading cryptocurrencies is not for others but for oneself. If you are willing to put in the effort and master it, trading cryptocurrencies will not be as difficult as you imagine.
In addition to strong techniques, I also strictly adhere to the following 8 ironclad rules:
1. A sharp drop is a test for quality tokens. If the market crashes and your token only drops slightly, it is evident that the market maker is defending the price, refusing to let it fall. Therefore, such tokens can be held with confidence; there will be rewards.
2. Once a main upward wave has formed and there is no significant increase in volume, decisively enter. If volume increases while holding, and if volume decreases but the trend is unbroken, continue holding. If volume decreases and breaks the trend, quickly reduce your position.
3. After buying short-term, if there is no movement in three days, sell if possible. If the price does not rise but falls after buying, cut losses unconditionally at 5%.
4. If a token drops 50% from a high position and continues to drop for 8 days, it has entered an oversold channel, and a rebound is imminent; you can follow up on this.
5. When trading cryptocurrencies, focus on the leading tokens, only trade the leaders and avoid the lesser-known ones. When the market rises, these leading tokens will soar the most, and when it falls, they are the most resilient. Don't hesitate to enter; trading cryptocurrencies often goes against human nature. Don't buy just because prices have dropped significantly, and don't avoid buying just because prices have risen. The more you hesitate to buy, the more they rise; the more you are eager to buy, the more they fall. The strong will remain strong. When trading leading tokens, the most important thing for short-term trading is to buy at high levels and sell at even higher levels!
6. Embrace the trend and act accordingly. The price at which to buy is not necessarily the lowest, but rather the most appropriate. You will not gain an advantage simply because the buying price is cheap since a downtrend does not guarantee a bottom. Abandon worthless tokens; the trend is king.
7. Don't let the blood of profits cloud your judgment. You must understand that the hardest thing in the world is how to sustain profits. You must seriously review whether it was luck or skill; a stable trading system that suits you is the true way to sustain profits.
8. Don’t trade just for the sake of trading. What does this mean? It means that when you are not confident that this trade will be profitable, do not force yourself to open a position. Staying in cash is an art; those who can buy are apprentices, those who can sell are masters, and those who can stay in cash are grandmasters. The first consideration in trading is not profit but capital preservation. Trading is not about frequency but about success rate!
So how can we trade cryptocurrencies well? Once a person enters the financial market, it is very difficult to turn back. If you are currently losing and still feel lost, but plan to make cryptocurrency trading your second career, you must understand the 'MACD indicator techniques.' If you can comprehend and master it, you can avoid many detours. These are personal experiences and insights, and I suggest you save and ponder them repeatedly!
The MACD indicator is one of the most classic technical indicators among all technical indicators. By correctly using this indicator and combining it with K-lines (daily, weekly), individual stock trends, volume, market trends, and news affecting the market, one can achieve good buy and sell results. Below, I will share the most comprehensive uses of the MACD indicator; only those who truly understand it are experts!
1. Explanation of the MACD indicator
1. Concept definition
MACD (Moving Average Convergence Divergence) describes the relationship between two moving averages, including a fast line and a slow line. Its main function is to judge and predict price trend changes or continuations.
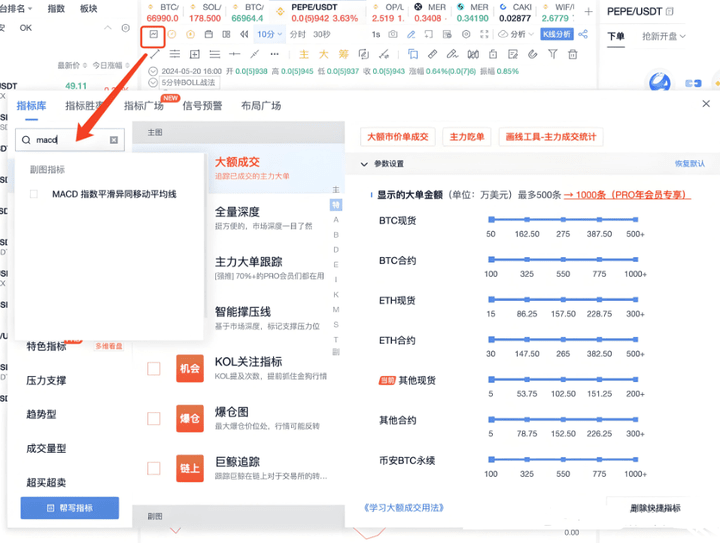
2. How to enable the MACD indicator
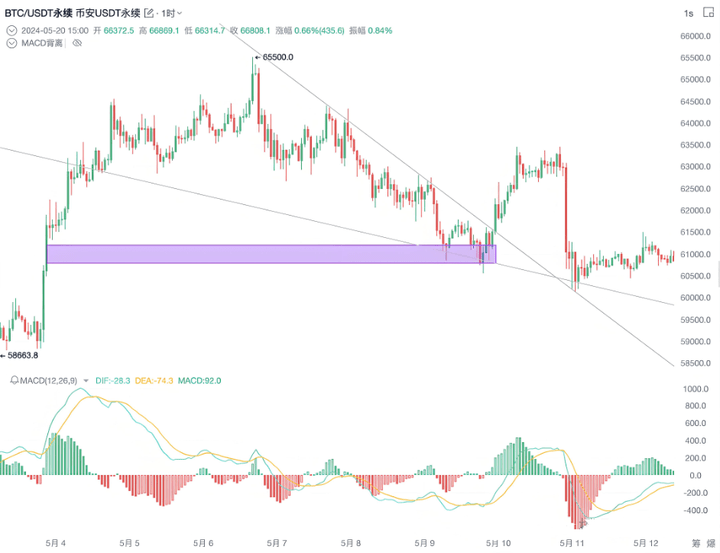
Open the indicator library, search for the MACD indicator, and check it. The MACD indicator will display below. Taking BTC/USDT trading on Binance as an example, when the price is 66997.99, switch to the BTC 1-hour line and set MACD's call 1 to spot. In the original setup, the short-term (N1) is 12, the long-term (N2) is 26, and the DEA period (M) is 9; you can use the original settings without making too many changes.
3. Green line and orange line
1. Green line (DIF, fast line): It is the difference between the short-term (12-period) EMA and the long-term (26-period) EMA. It reacts sensitively to market changes, reflecting short-term market fluctuations.
2. Orange line (DEA, slow line): It is the 9-period EMA of the DIF, relatively smoother, reflecting longer-term market changes and lagging compared to the fast line.
3. MACD Energy Bars: Show the difference between DIF and DEA. Through these three elements—green line, orange line, and energy bars—we can judge the market's trend and momentum changes.
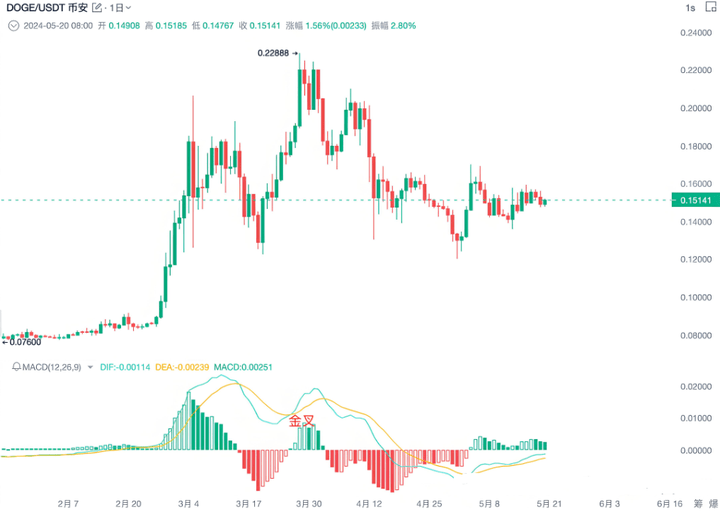
2. MACD Golden Cross and Death Cross Trading Strategy
When the price is in a downtrend, and the fast line crosses above the slow line, forming a golden cross, it indicates that the trend may shift from down to up, providing a trading opportunity.
When the price is in an uptrend, and the fast line crosses below the slow line, forming a death cross, it indicates that the trend may shift from up to down, making it a reasonable short entry point.
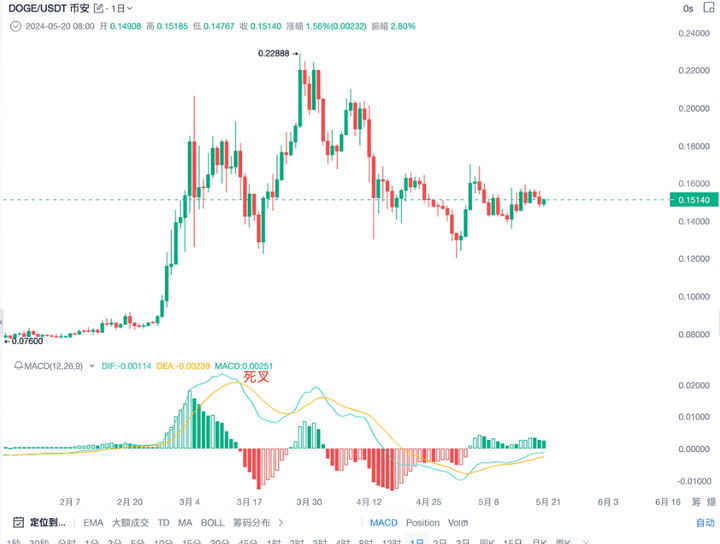
This is the traditional use of MACD.
3. MACD Divergence Trading Strategy
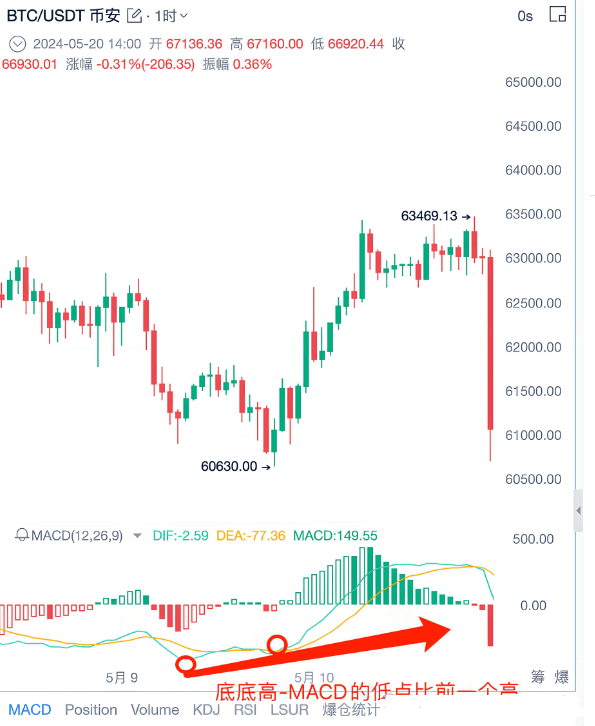
1. MACD Top Divergence
When the price's high is higher than the previous high, this is a higher high.
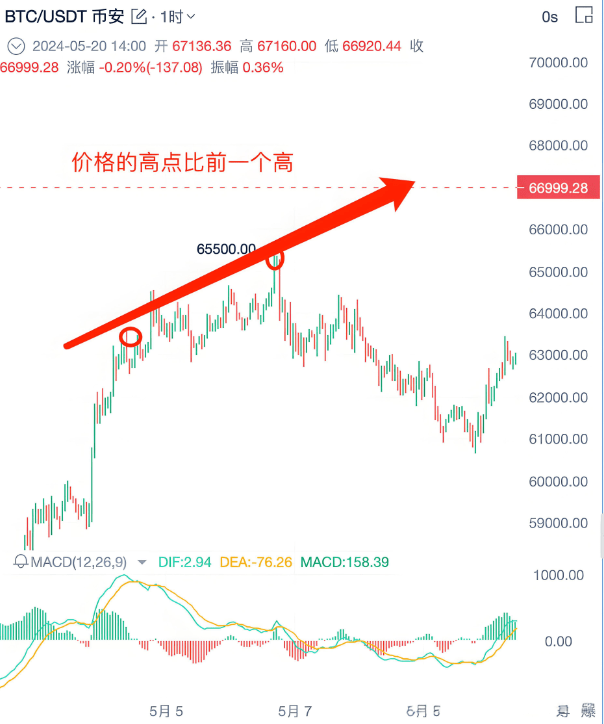
When the price's high is higher than the previous high, that forms a higher high. Typically, MACD should also form a higher high to match the price trend momentum.
If at this time the MACD forms a lower high, it indicates that the price trend momentum is weakening.
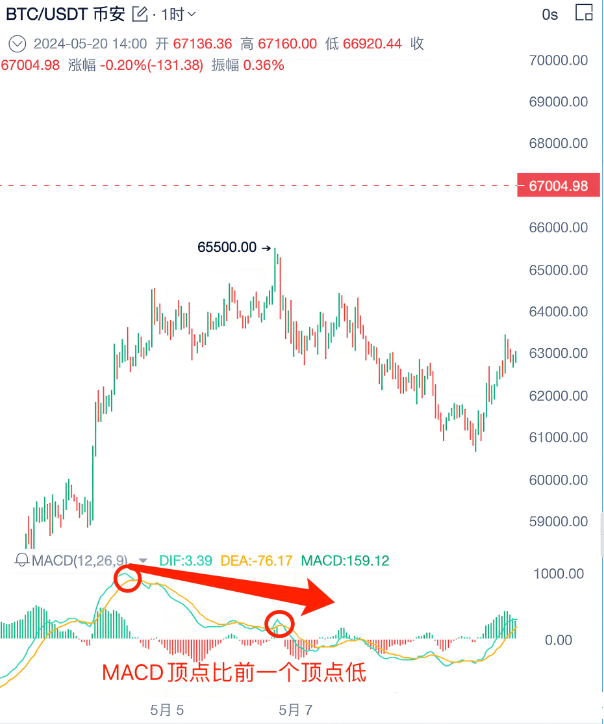
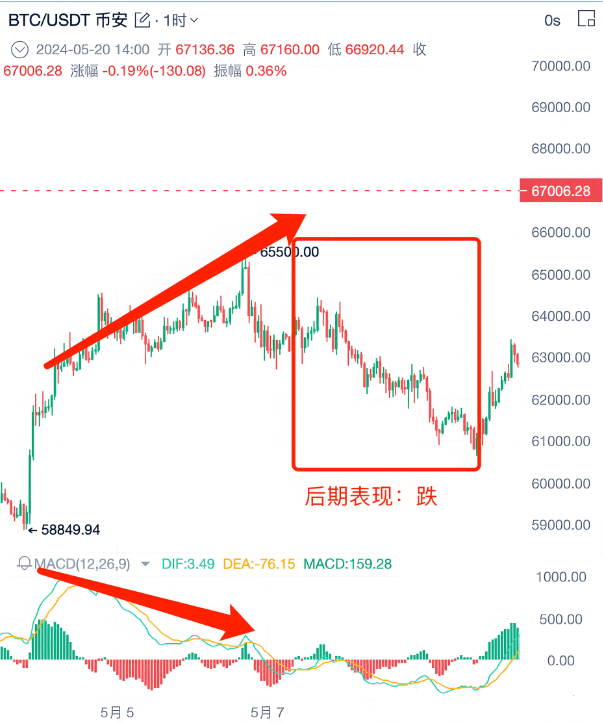
When the price forms a higher high while the MACD forms a lower high, this is a top divergence. At this point, the price trend is likely to shift downward.
To confirm the trend, one must find the key price levels and MACD trend reversal divergence.
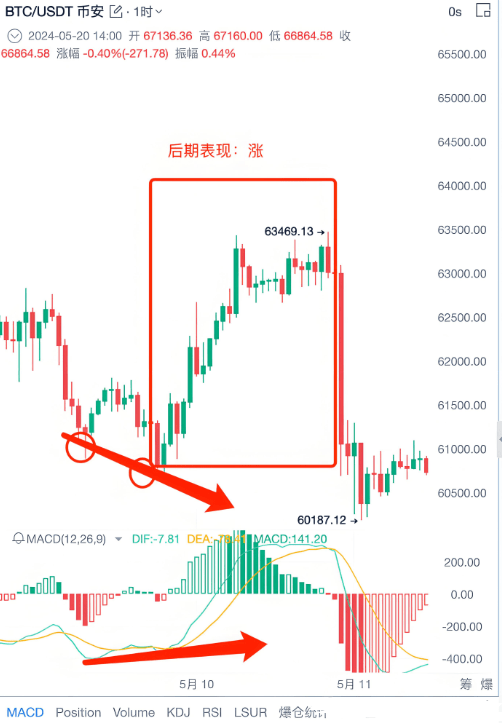
2. MACD Bottom Divergence
When the price's low is lower than the previous low, this is a lower low.
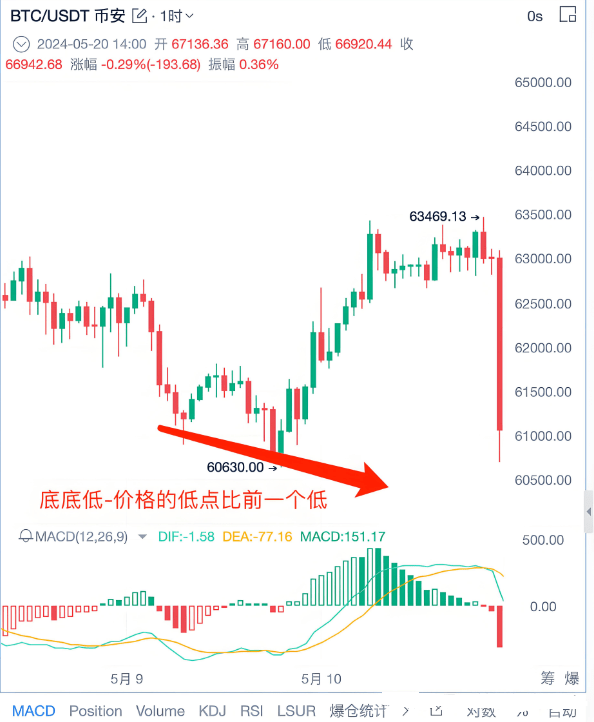
If at this time the MACD forms a higher low, it means that buying momentum is starting to enter, and the price drop momentum is gradually weakening.
It is highly likely that the trend will shift from a downtrend to an uptrend. When the price forms a lower low, but the MACD forms a higher low, this is a lower divergence, indicating that the trend is likely to shift to an uptrend, providing a reasonable buying opportunity.
3. MACD trend reversal trading strategy
Key price levels and MACD trend reversal divergence: Find two peak connection lines, while also locating the corresponding two peaks at the bottom MACD.
Determining key support levels: When the price repeatedly tests a certain support level and then experiences a significant rise, that support level is the key support level. When the price returns to the key support level, look for trading signals to go long.
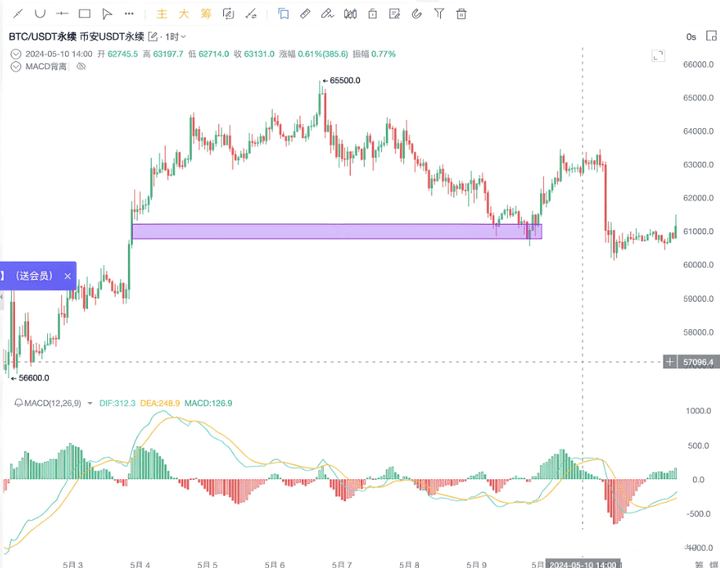
For example, we find a peak that has gone through a round of rises and falls and has returned to the support level.
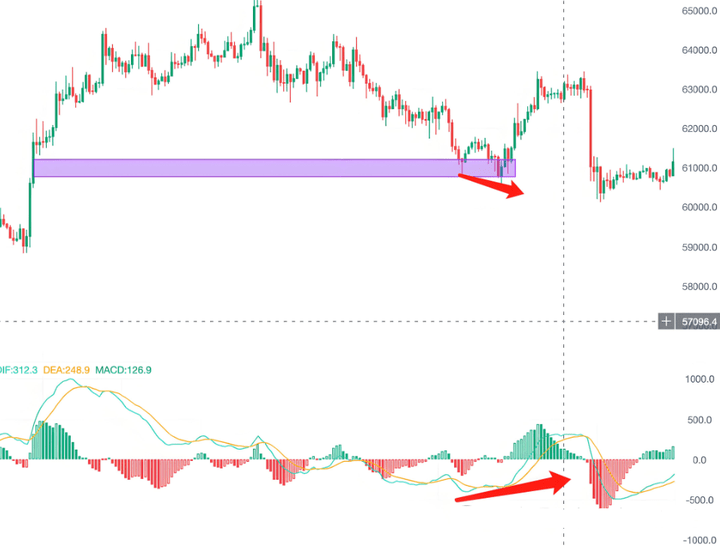
For example, when the price retraces to the support level after a round of rises and falls, it cannot be directly bought long; an additional signal is needed to confirm the effectiveness of the lower divergence. A downtrend line can be drawn; if a descending wedge triangle (a bullish chart pattern) forms, when the price breaks through the descending wedge triangle, a long position can be entered.
You can see that this is a descending wedge triangle, which is a bullish chart pattern. When the price breaks through this descending wedge triangle, we can enter a long position.
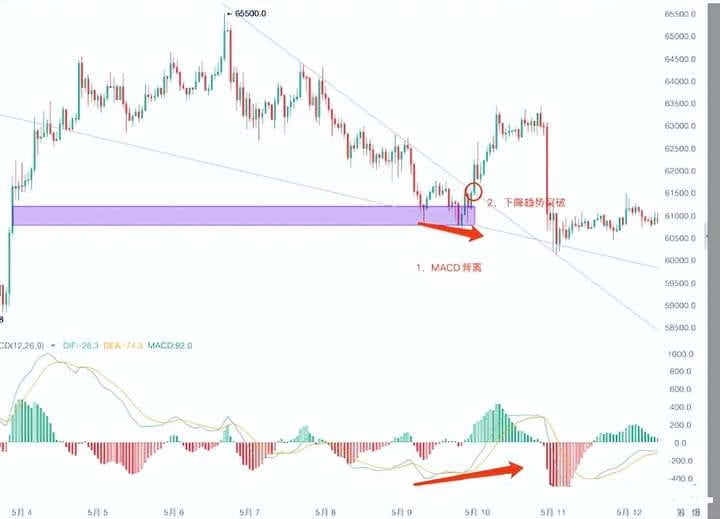
If these two points are met and the descending trend line is broken, consider going long. Draw a line at the previous high in a downtrend. When the price breaks the previous high, it indicates a trend reversal, and the price is likely to shift from a downtrend to an uptrend. You can enter a long position after the price breaks the previous high. In summary, trading needs to combine key price levels with MACD trend reversal divergence. In brief: Key price levels + MACD trend reversal divergence.
4. How to find support levels?
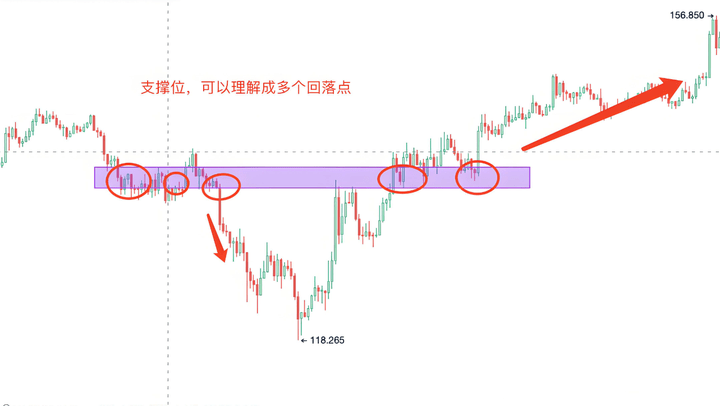
Support levels can be understood as multiple retracement points that can form valleys or peaks. At the foot of the mountain, the price will often retest. A support level can be a small price range or a specific price point. At the same time, it is essential to combine MACD divergence and key price levels for judgment, focusing on whether the support level has been broken.
The above are the most practically meaningful MACD strategies. These techniques can be applied to different markets, different varieties, and different time frames, suitable for most traders to learn and use.
Even the most diligent fisherman would not go out to sea during a storm but would instead carefully guard his boat. This season will pass, and a sunny day will come! Pay attention to Yan An, who teaches you both fishing and how to fish. The door to the cryptocurrency world is always open. Only by going with the trend can one have a life that aligns with it. Save this and keep it in mind!
