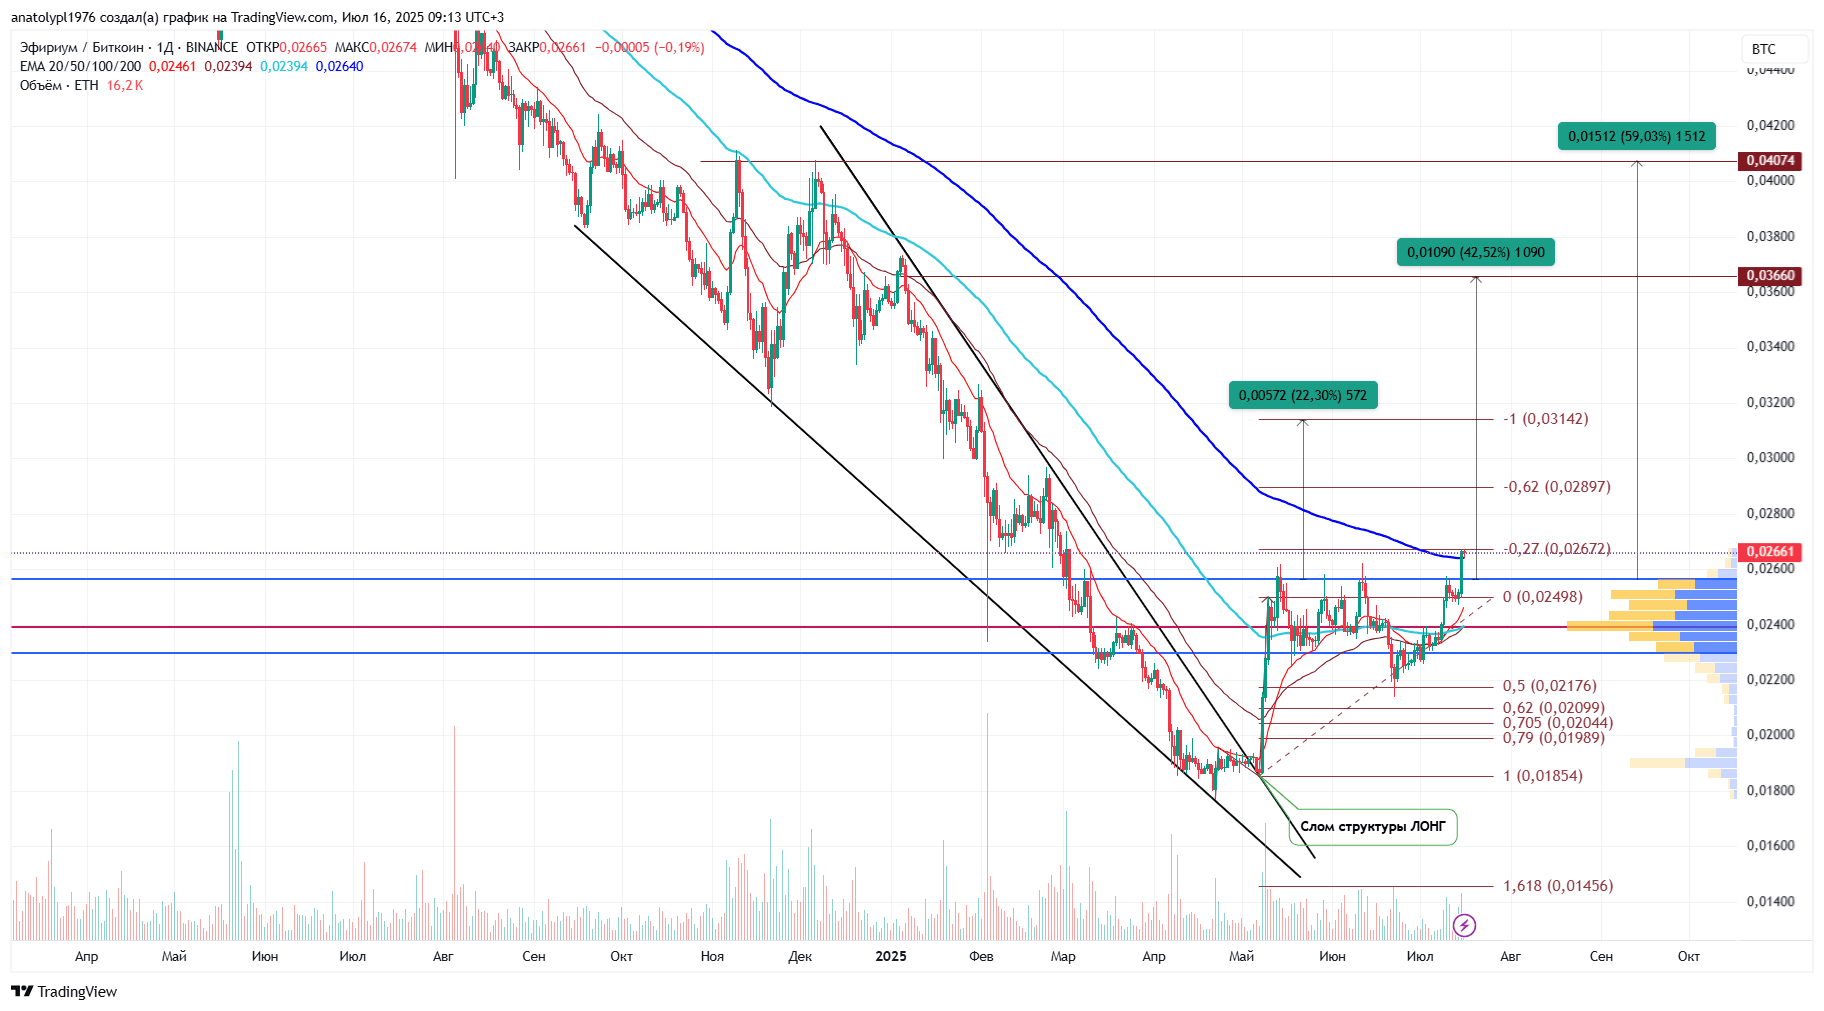
📉 Current price: 0.02661 BTC
🔍 Key levels and data:
Indicator Value
EMA 20 0.02461
EMA 50 0.02394
EMA 100 0.02394
EMA 200 0.02640
Volume (ETH) 16.2K
Fibo 0.0 0.02498
Fibo -0.27 0.02672 (current breakout level)
Fibo -0.62 0.02897
Fibo -1.0 0.03142
Target zones 0.03142 / 0.03660 / 0.04074
Inclined channel Broken down — signal of structure change
Increase of targets (for long)
→ +22.30% (0.03142)
→ +42.52% (0.03660)
→ +59.03% (0.04074)
🧠 Graphic analysis:
✅ A break in the descending trend structure with a clear breakdown of the channel downward is observed.
✅ The price has settled above EMA 200, for the first time in a long time — bullish signal
✅ Level 0.02672 by Fibonacci (-0.27) is broken — a trigger for the long scenario
📈 Volume is moderate, without strong spikes (but above average for the last weeks)
🔄 LONG Scenario (main)
Probability of execution: 🟢 70–75%
🔹 Entry points:
Entry 1: 0.0260–0.0266 (retest Fibo -0.27 + EMA200)
Entry 2 (more aggressive): 0.0250–0.0253 (if there is a false breakout)
🔹 Stop Loss:
Below the trend break zone: 0.02450–0.02480
(below Fibo zone 0.0 and under EMA20)
🎯 Take Profit:
TP1: 0.0314 (+22%)
TP2: 0.0366 (+42%)
TP3: 0.0407 (+59%)
⚖️ Leverage:
Recommended: x3–x5 maximum, as the ETH/BTC pair is more volatile towards BTC rather than in dollars
🛑 SHORT Scenario (alternative, unlikely):
Probability of execution: 🔴 25–30%
(only in case of a strict false breakout and falling below 0.0245)
Entry: 0.0245
Stop Loss: 0.0270
TP1: 0.0220, TP2: 0.0188, TP3: 0.0145
✅ Conclusion:
Main priority: LONG
Consolidation above EMA 200 and exit from the descending channel gives confidence in the growth potential.
Upon a pullback to 0.025–0.026, it makes sense to consider building a position with a target up to 0.036–0.040 BTC
The strategy is confirmed by the structure, Fibonacci levels, and EMA dynamics.
📌 What does executing the long scenario for the ETH/BTC pair mean?
The ETH/BTC pair shows the strength of Ether relative to Bitcoin, not directly to the dollar. That is:
If ETH/BTC rises, it means that Ether is rising faster than Bitcoin.
If ETH/BTC falls, Ether rises slower or even falls harder than Bitcoin.
📈 If the long scenario is executed (ETH/BTC up), then:
Ether is becoming stronger than Bitcoin.
Investors/traders are flowing from BTC to ETH.
This is usually accompanied by an increase in ETH in dollars.
Price growth is expected #ETH in the pair to USDT (or USD).
If BTC is stagnant or even growing — ETH almost always grows stronger at this moment.
There is often a phase of 'alt-season' where Ether leads.
Long execution on ETH/BTC may trigger a wave of growth in altcoins, as Ether is their flagship.
📊 An example of what this looks like:
Scenario BTC/USDT ETH/USDT ETH/BTC
BTC is rising by 5% +5% +10% growing
BTC is stagnant 0% +5–7% growing
BTC is falling by 5% -5% -2% growing
📌 That is, the growth of ETH/BTC = outperformance of Ether over Bitcoin.
✅ Conclusion:
If the long scenario for #ETH/BTC is executed — this is a highly probable signal for price growth of Ether in dollars.
This is a bullish signal for both Ether and second-tier altcoins. For the trader, this could be a trigger for:
Buying ETH in the pair to USDT
Growth of DeFi altcoins based on Ether
Overall shift towards altcoins