Bitcoin (BTC) has reversed to adjust after setting a new historical peak at $123,218 on Monday, indicating that profit-taking pressure is starting to appear at high price levels. However, this movement seems to be merely technical, as fundamental investment demand remains very strong. According to data from BitcoinTreasuries.NET, companies holding Bitcoin accumulated a total of 159,107 BTC in Q2 – a figure that reflects institutional confidence in this asset over the long term.
Not only the 'big players', but also the group of retail investors are actively participating. Monday's market report from Bitfinex reveals that individual investor groups – including 'Shrimp' (<1 BTC), 'Crab' (1–10 BTC), and 'Fish' (10–100 BTC) – are buying about 19,300 BTC each month. Notably, this figure far exceeds the amount of newly issued BTC each month (about 13,400 BTC) since the halving event in April 2024.
With overwhelming demand from both institutions and individuals, does BTC have enough momentum to conquer the $150,000 mark? Let's analyze the technical chart to find the answer.
BTC Technical Analysis
Bitcoin is currently undergoing a correction, likely pulling the price toward the neckline of the inverted head and shoulders pattern, near the $113,000 area.
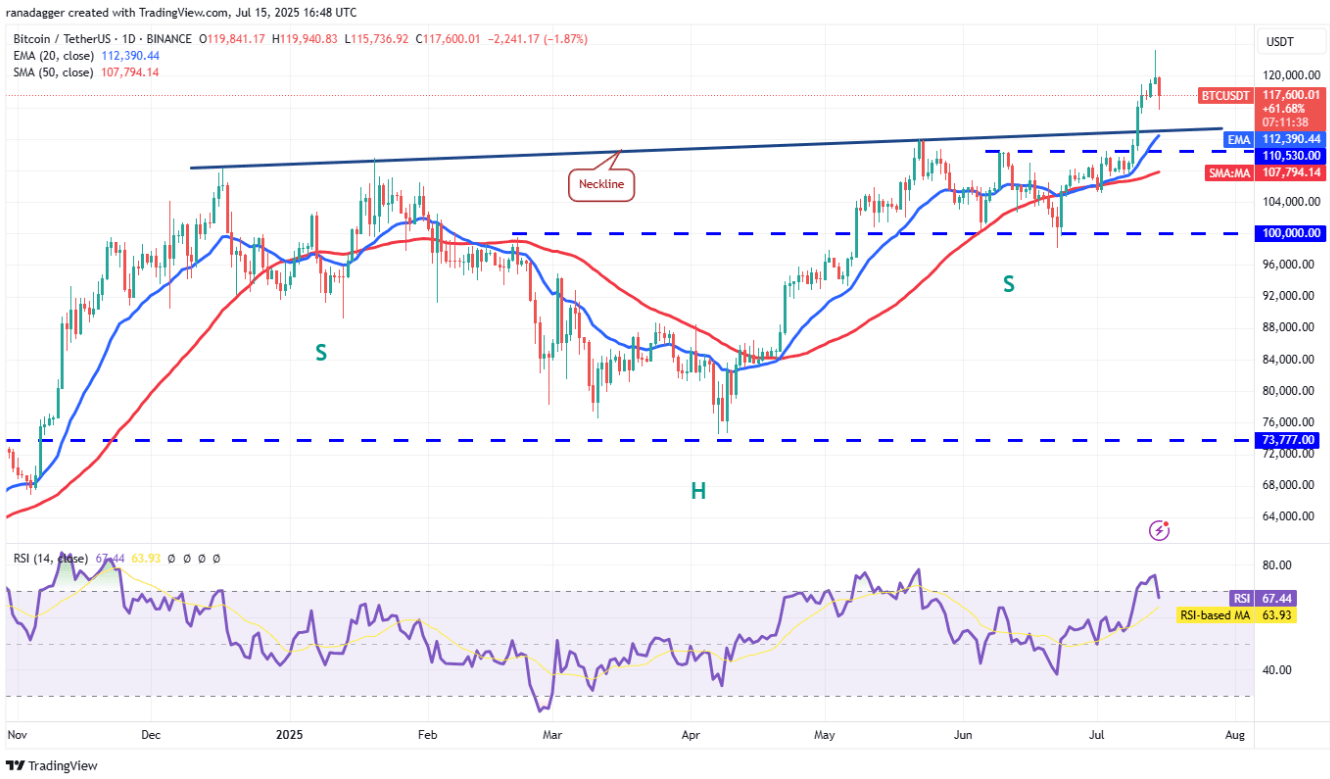
The 20-day exponential moving average (EMA) is trending up ($112,390) along with the relative strength index (RSI) hovering near the overbought zone, indicating that the advantage still lies with the bulls. If the price bounces back from the 20-day EMA, the bulls will attempt to push the BTC/USDT pair above $123,218. If successful, the price could continue to rise to the target model of $150,000.
On the contrary, if the price breaks and closes below the 20-day EMA, it will signal that the upward momentum is weakening, which could delay the next upward trend. In this case, BTC could drop to the 50-day simple moving average (SMA) at $107,794.
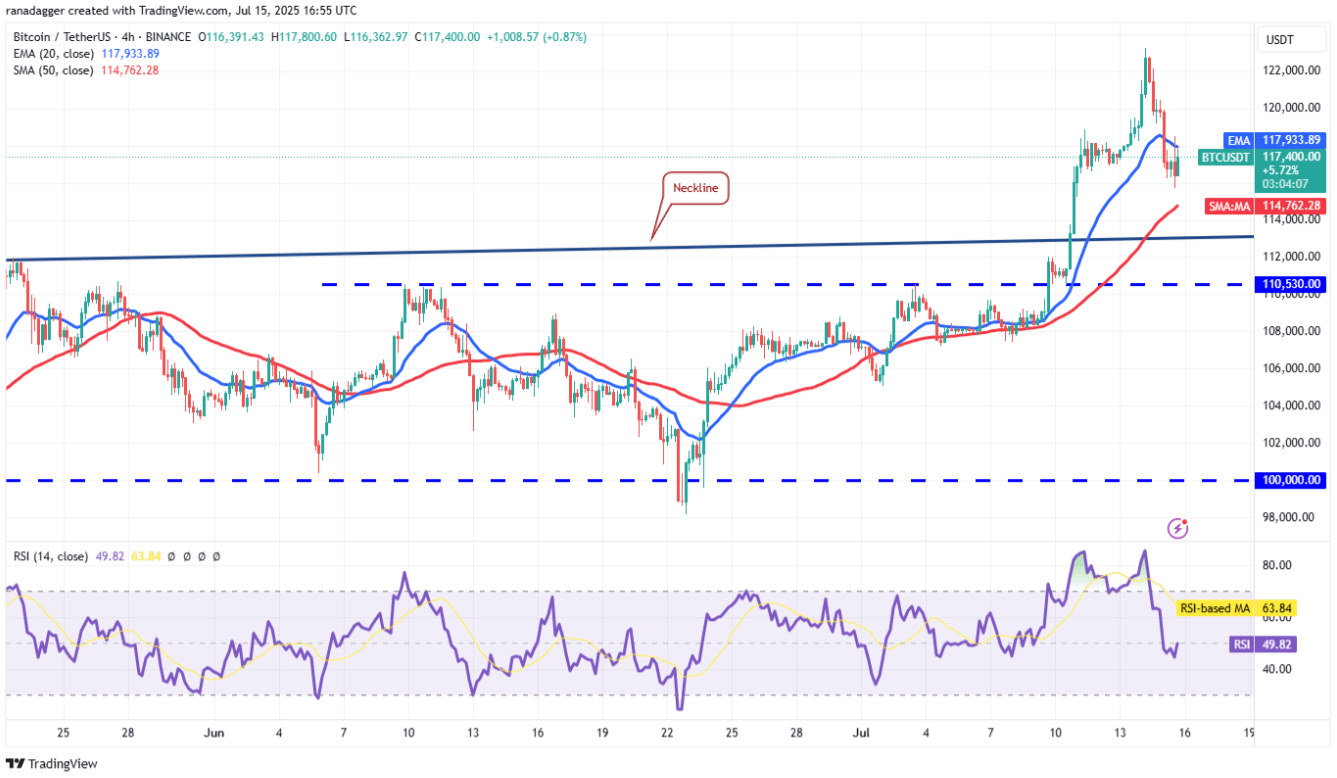
On the 4-hour chart, the BTC/USDT pair has broken through the 20-period EMA, indicating a weakening signal in the short term. The bulls are currently trying to create a recovery, but are likely to encounter selling pressure at the 20-period EMA. If the price turns down from this EMA and breaks below $115,000, it could drop to the neckline.
The bulls are expected to actively defend the support area from the neckline down to $110,530. If the price bounces back from this area and rises above the 20-day EMA, it would be a sign that the bulls are returning. In that case, BTC could once again target the $123,218 mark.
However, this positive scenario will be invalidated in the short term if the price breaks below $110,530. At that point, BTC could drop to $108,000, or even $105,000. The deeper the correction, the longer the time needed to recover and continue the upward trend.
