The price of Solana may be slowing down from its recent peak of $168, but the larger structure still favors the bulls.
Despite the correction to $160, three key metrics indicate that this represents a temporary pause rather than a breakdown.
Funding prices remain positive, reflecting bullish sentiment.
SOL funding price indicators are still green, indicating dominance of long buy positions in the market. Despite a slight decrease in price, traders are still paying fees to maintain long buy positions, suggesting that most expect the price to rise again.
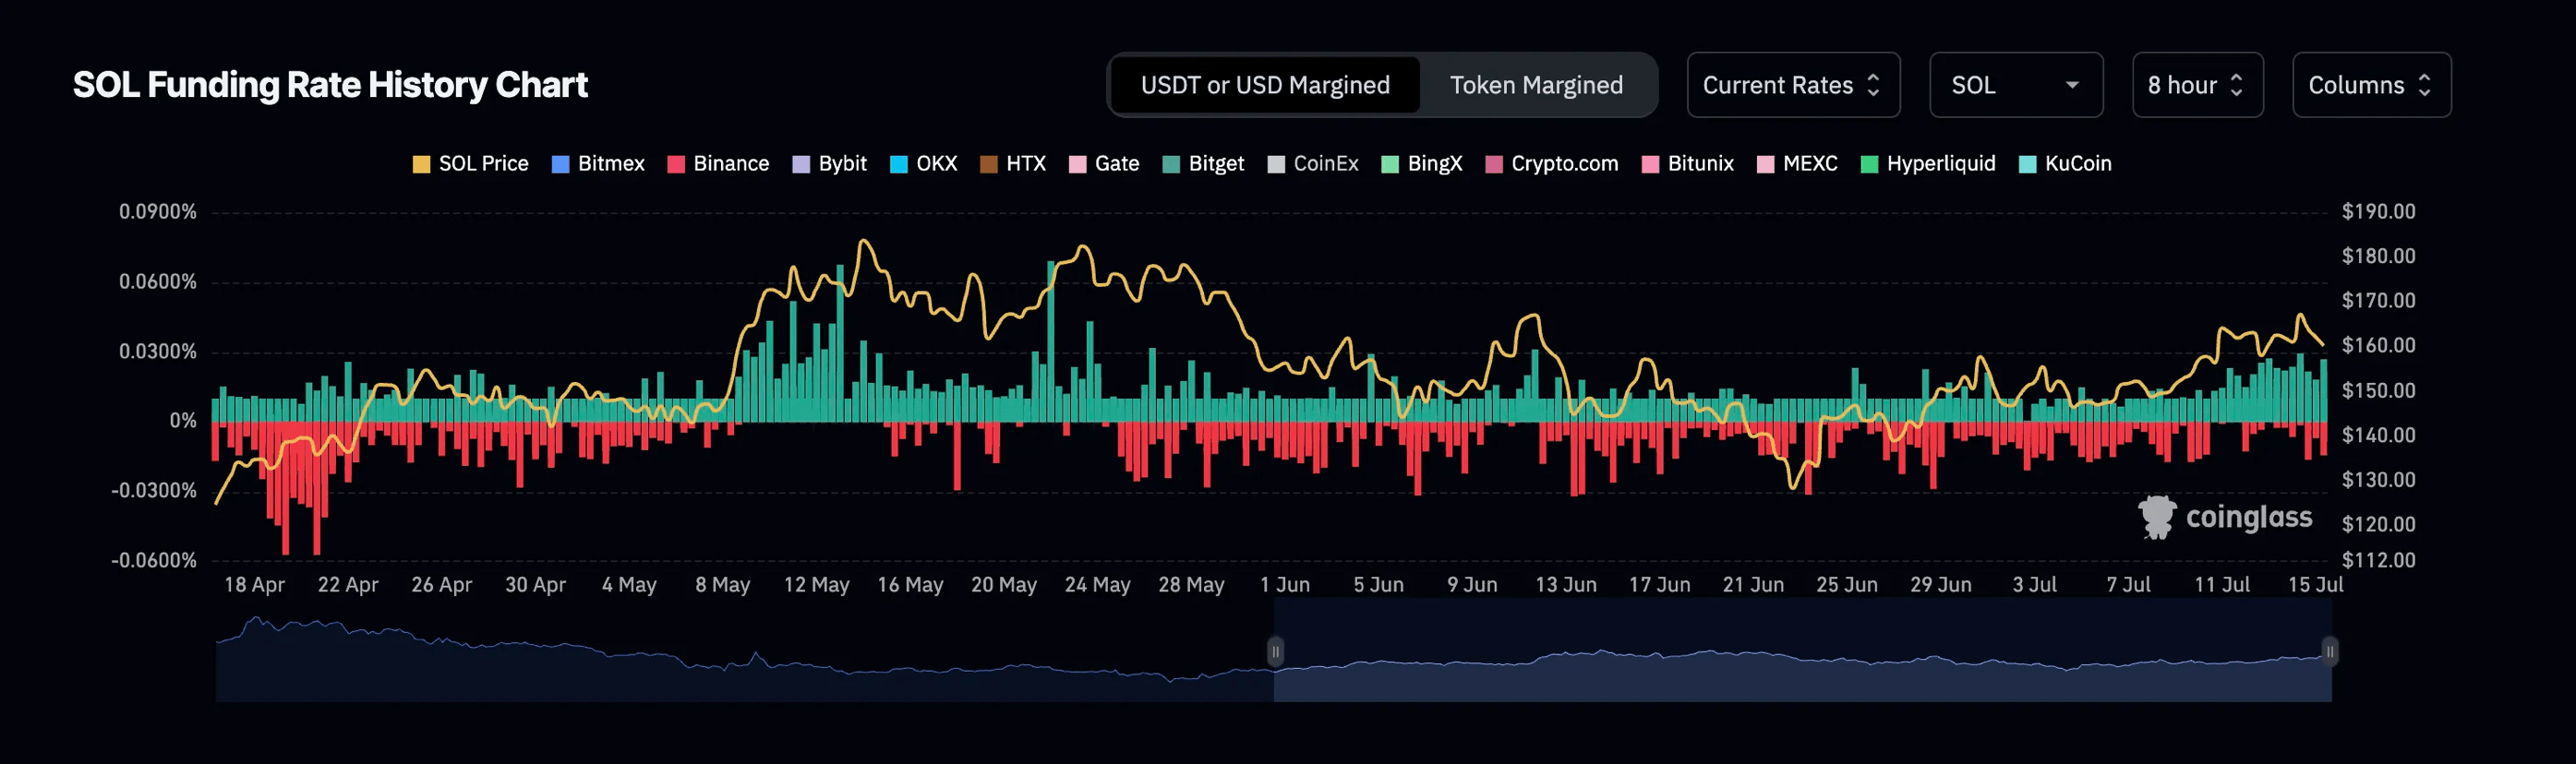
There are no signs of dominance from short selling. This generally indicates buyers' willingness to hold the market during volatility.
Funding rates are periodic payments made between perpetual futures traders (long and short). When rates are positive, long-term traders are in control, while paying short-term trades, indicating an upward trend.
The golden crossover of the 20/50 exponential moving average confirms the bullish trend.
Recently, Solana observed the 20-day exponential moving average crossing above the 50-day exponential moving average on the daily chart. This 'golden crossover' is a bullish signal indicating a restoration of short-term momentum. However, this crossover did not occur on a strong green candle; rather, it occurred on a red candle with long wicks, indicating some hesitation in the market.
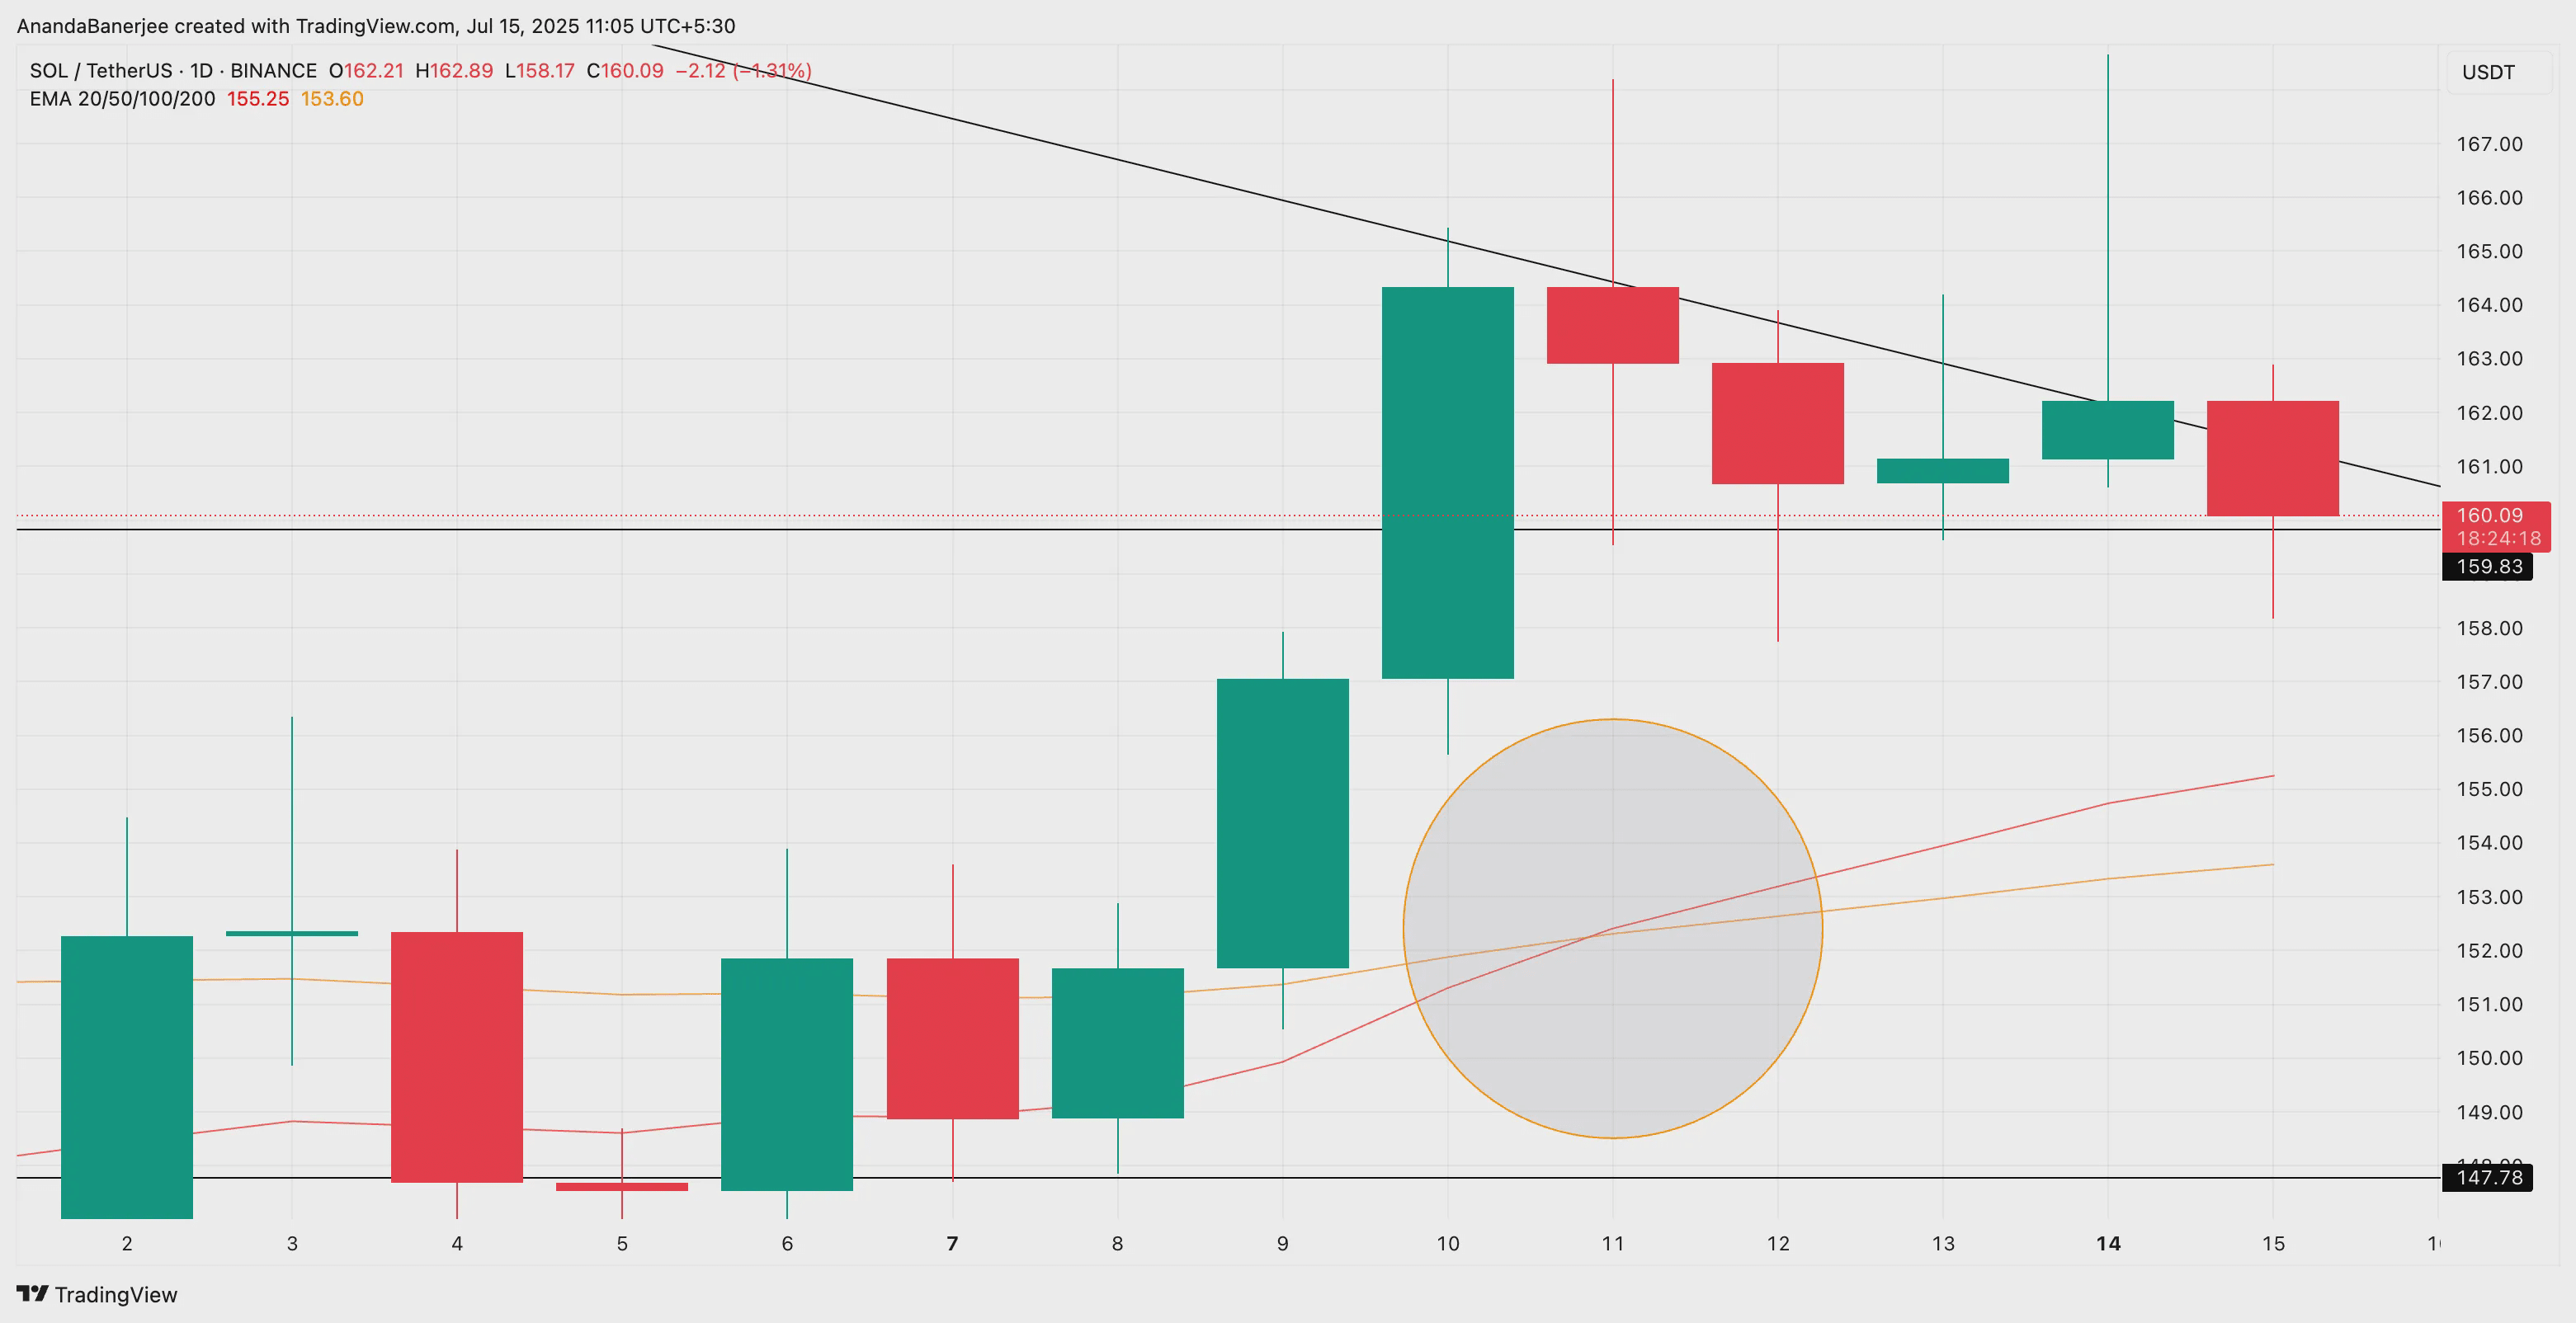
However, this crossover supports the idea that the price trend of SOL is moving upwards, even if the immediate momentum seems shaky.
The price of SOL is above the main support level with a solid structure.
Despite the pullback to $160, Solana remains anchored near a key support zone around $158, as expected from a Fibonacci retracement, a useful tool for mapping key support levels during an uptrend.
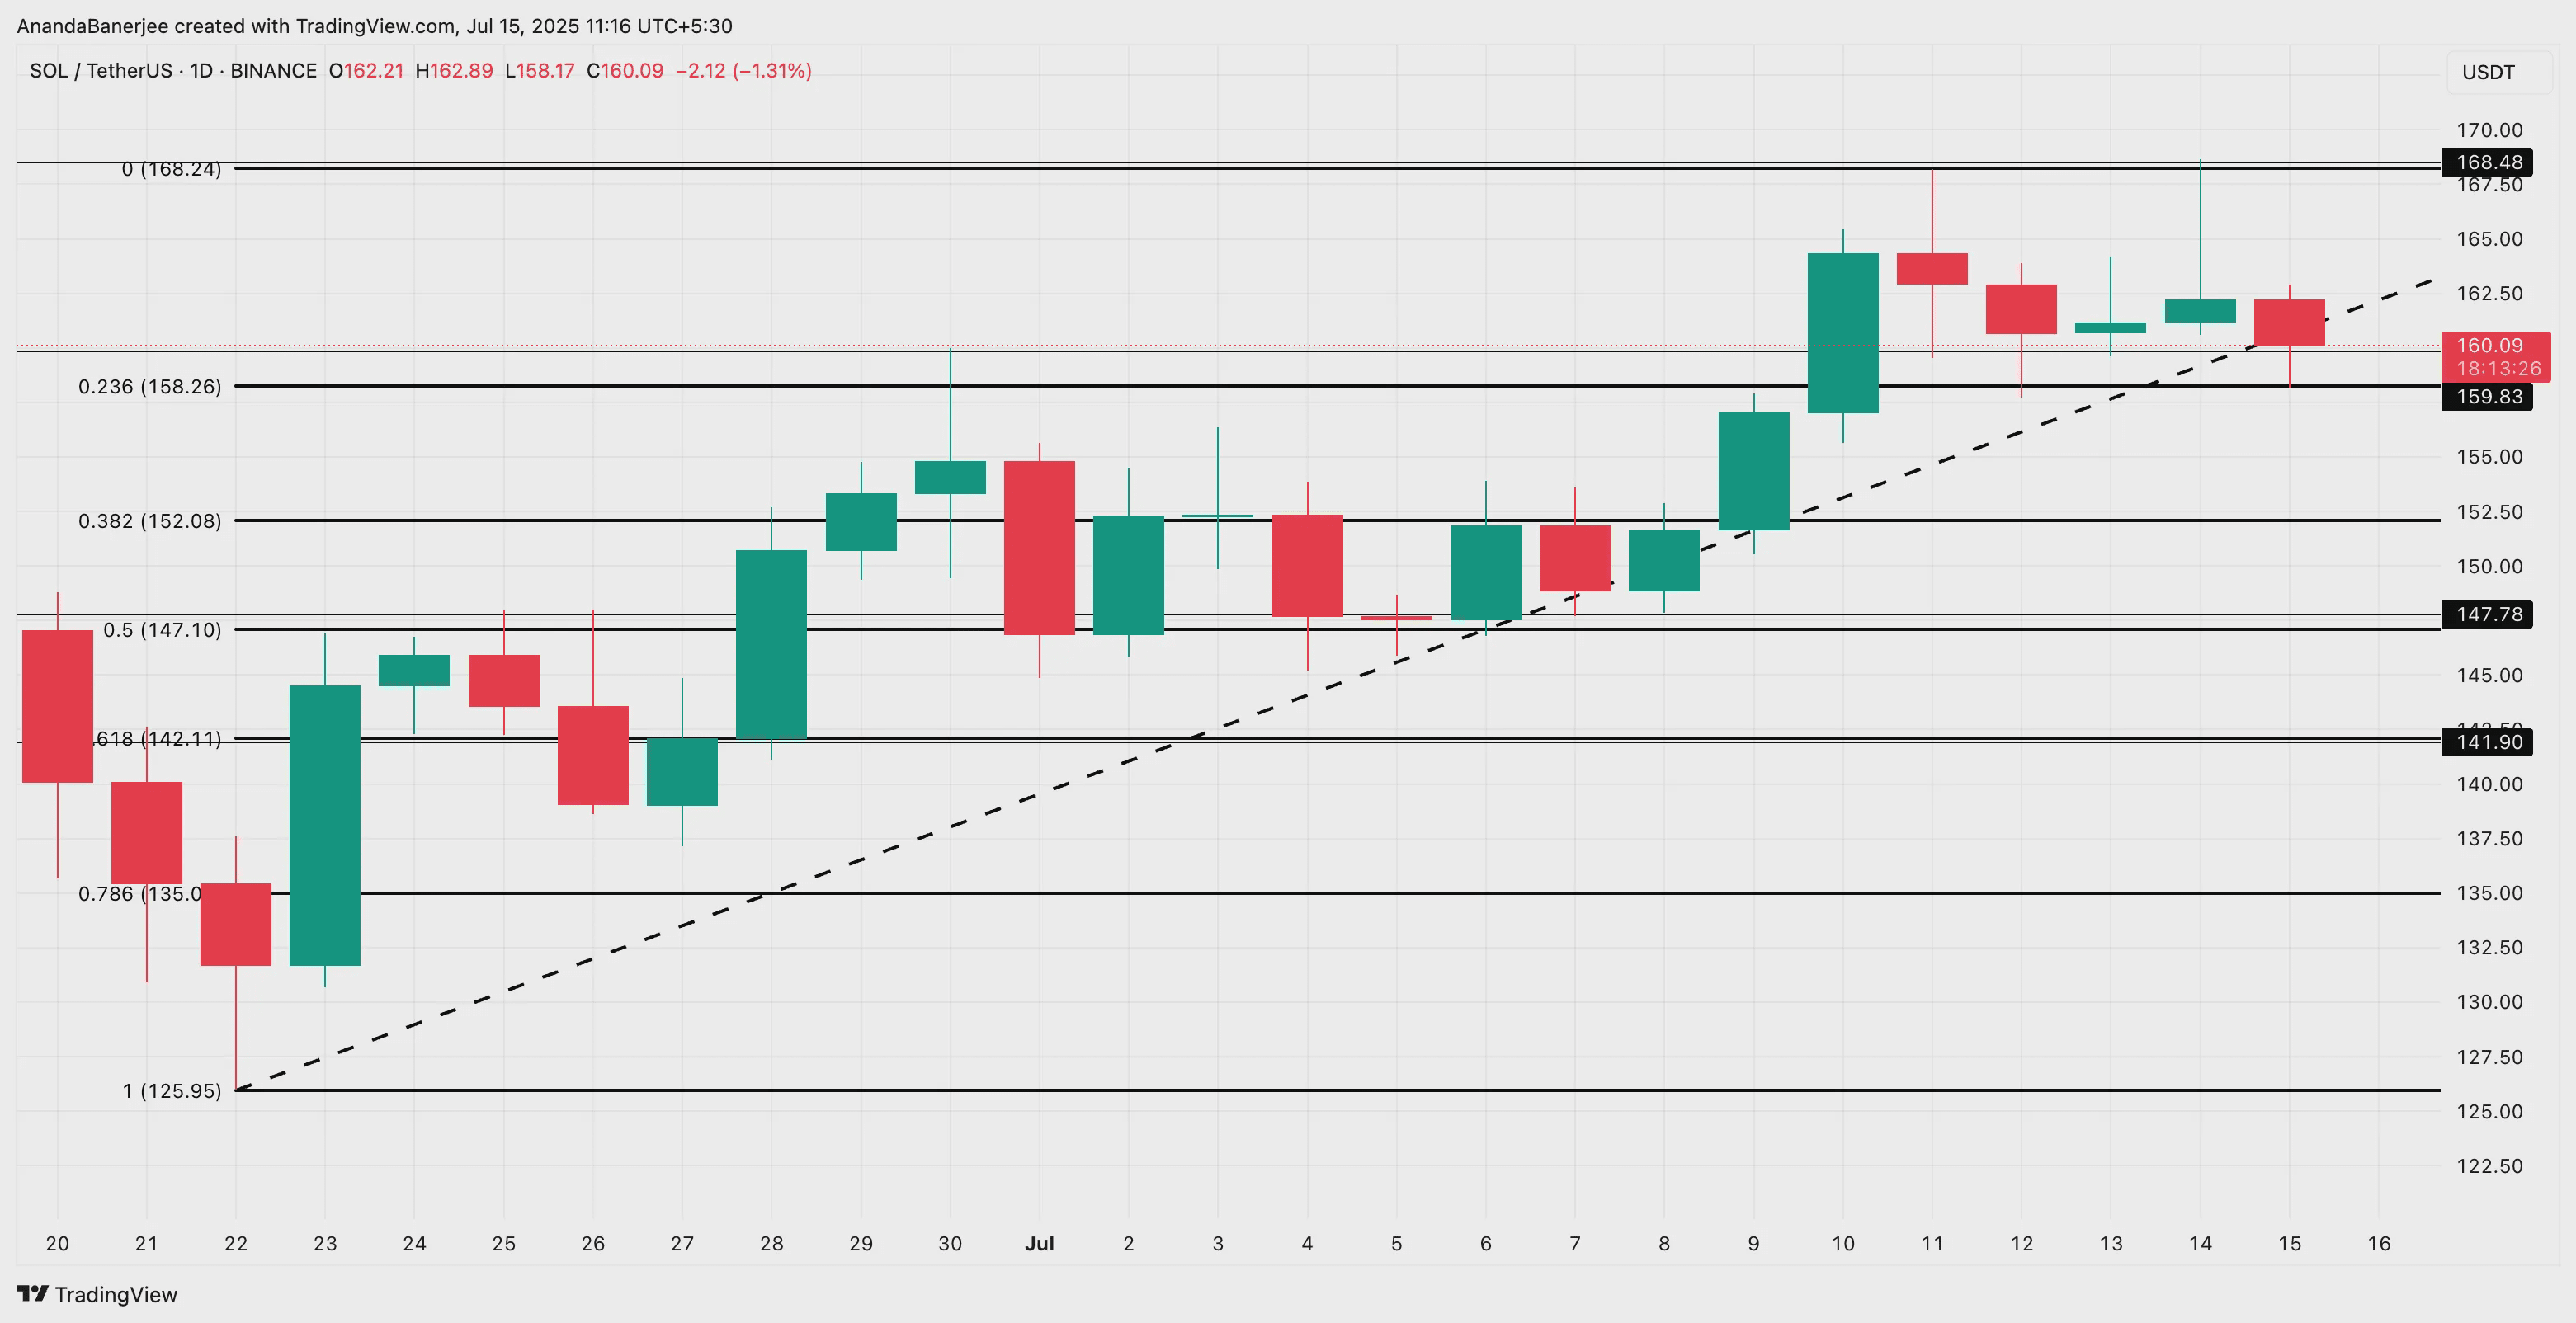
On the positive side, if the price of Solana recovers to $168, while funding rates remain positive, the next phase of the rally will open. This would allow the price of Solana to reach $179, or even $184, provided that the market remains generally optimistic.
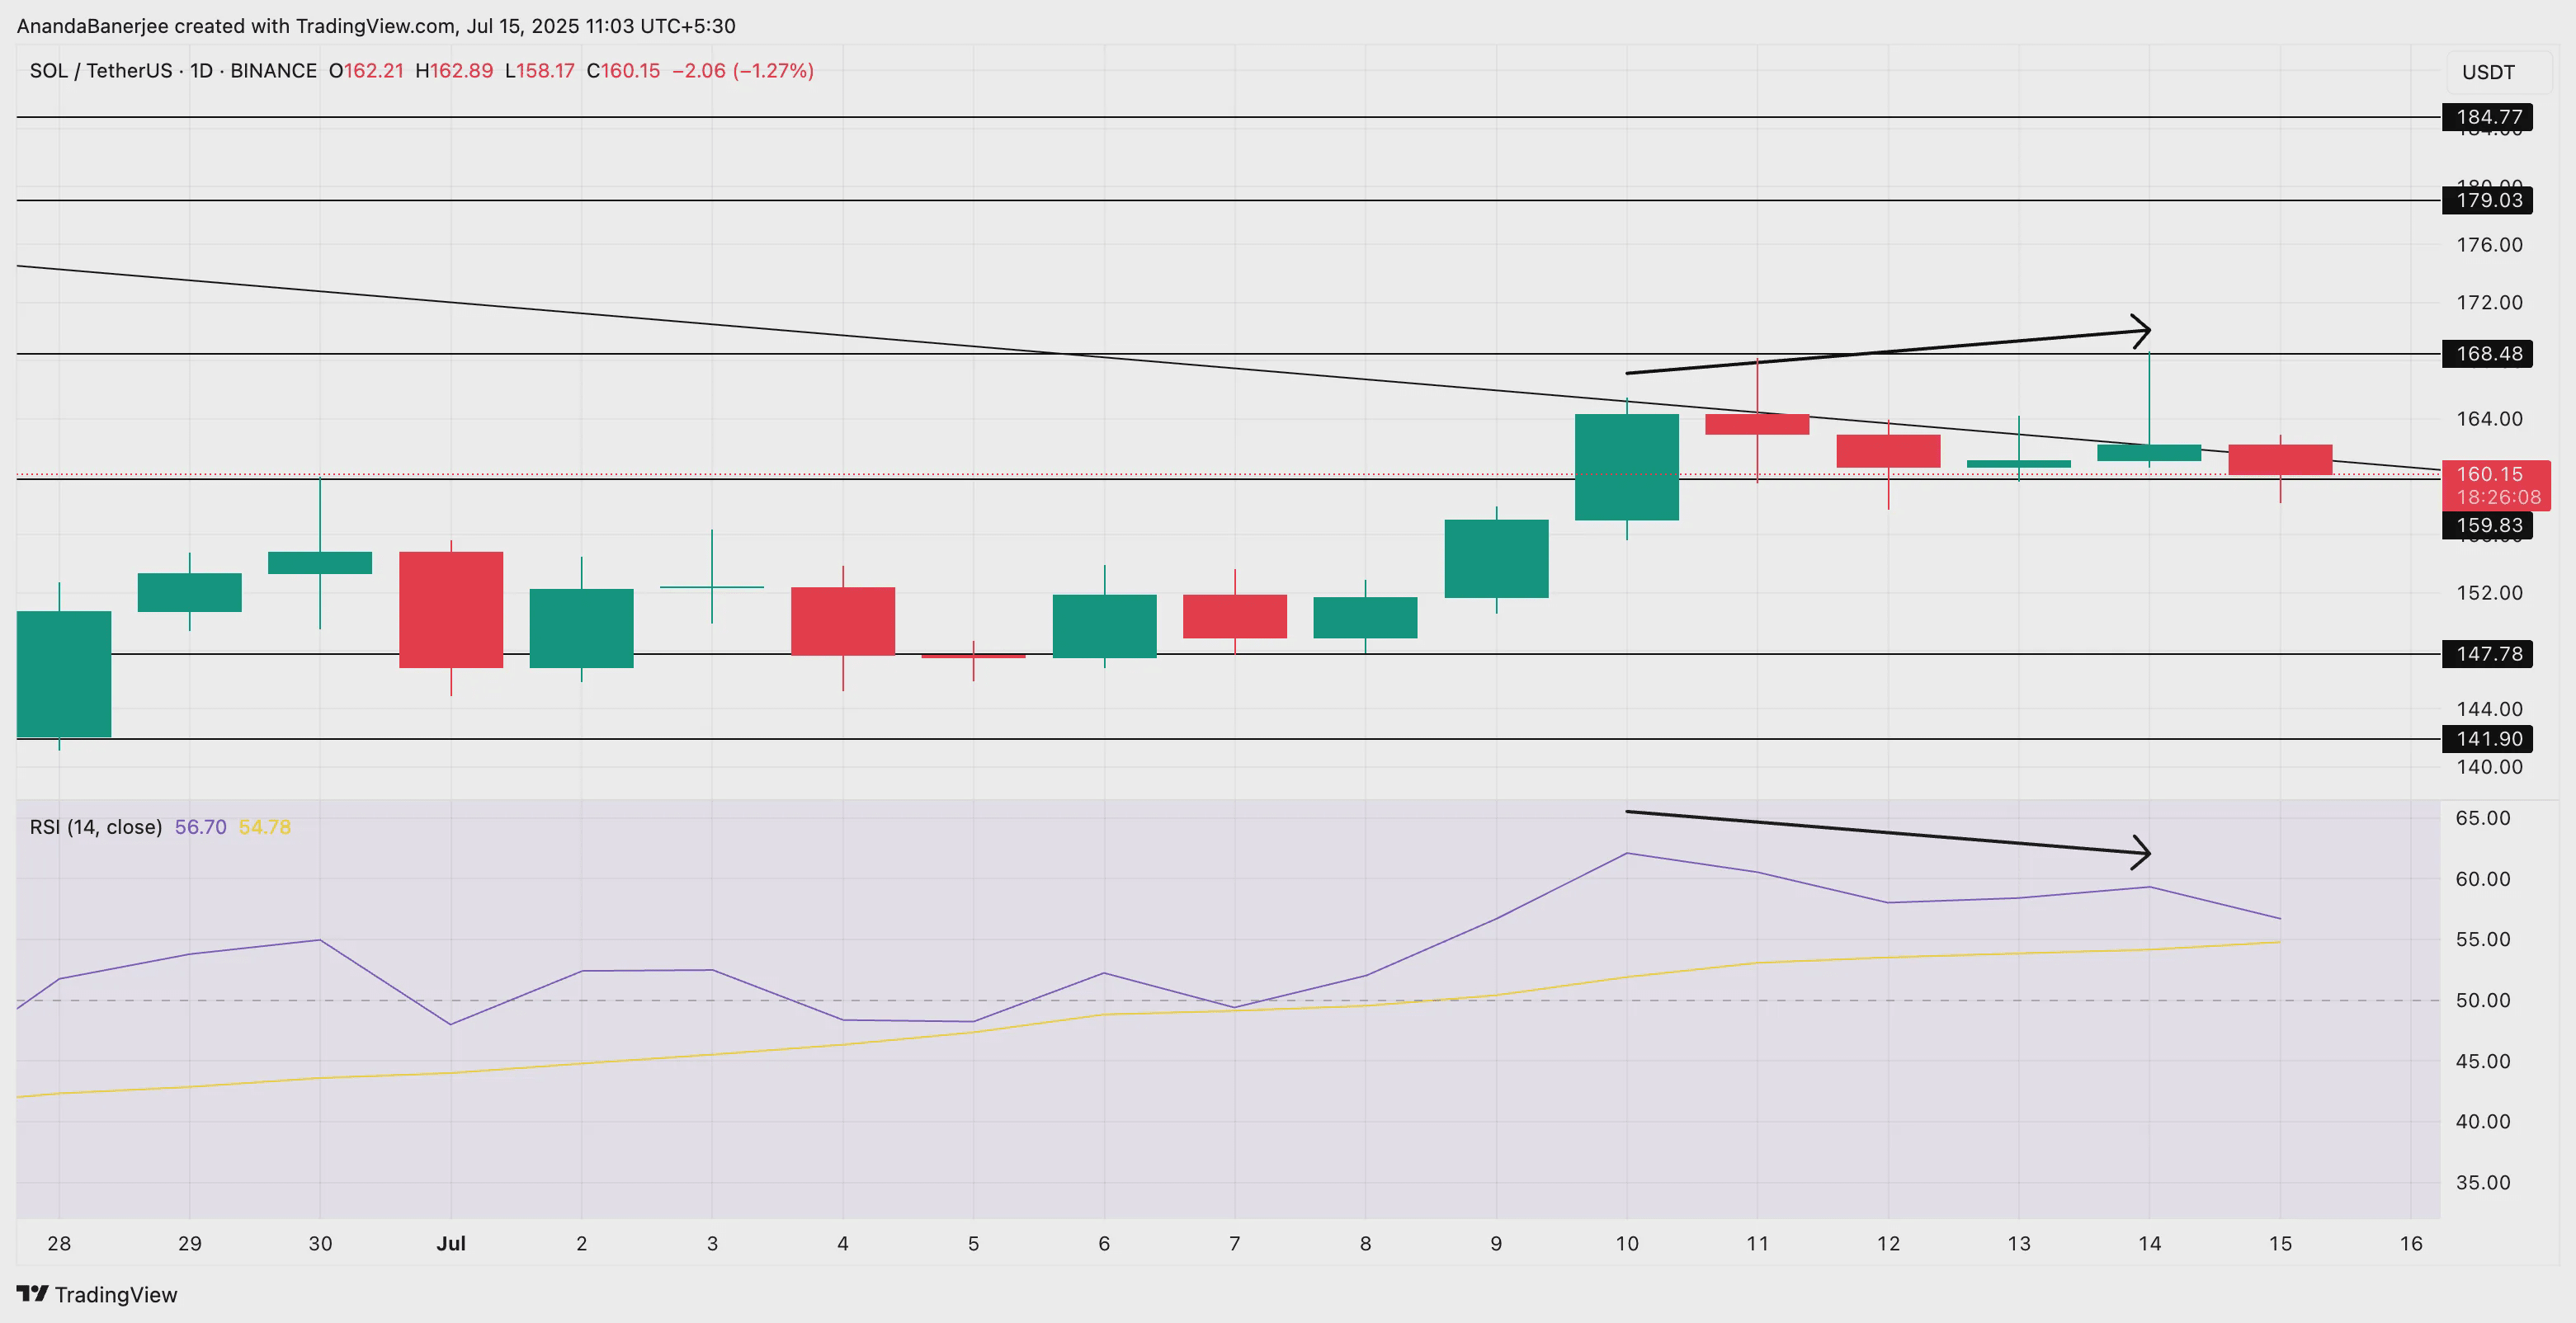
Nonetheless, there is a clear downward divergence in the Relative Strength Index between July 10 and 14. The price of SOL registered a higher peak, while the Relative Strength Index recorded a lower peak; indicating weakness in momentum despite the rise in SOL's price. This divergence often leads to short-term corrections, which we are witnessing now.
Additionally, the Relative Strength Index has begun to bend downwards after approaching its signal line, reinforcing the likelihood of a temporary slowdown.
The Relative Strength Index (RSI) is a momentum indicator that tracks the strength of buying or selling pressure. Divergence, when the price rises while the Relative Strength Index falls, usually signifies a decline in momentum.
The downward divergence of the Relative Strength Index could negate the broader bullish structure if followed by a drop below $158. A correction to $152 (Fibonacci level 0.382) or lower ($147) could reverse the structure into a downward trend in the short to medium timeframe.