With Ethereum's TVL reaching $74.4 billion and daily active addresses on the rise, the institutional adoption rate of Ethereum has surged, with spot ETH ETFs driving capital inflows, pushing ETH back above $3,000.

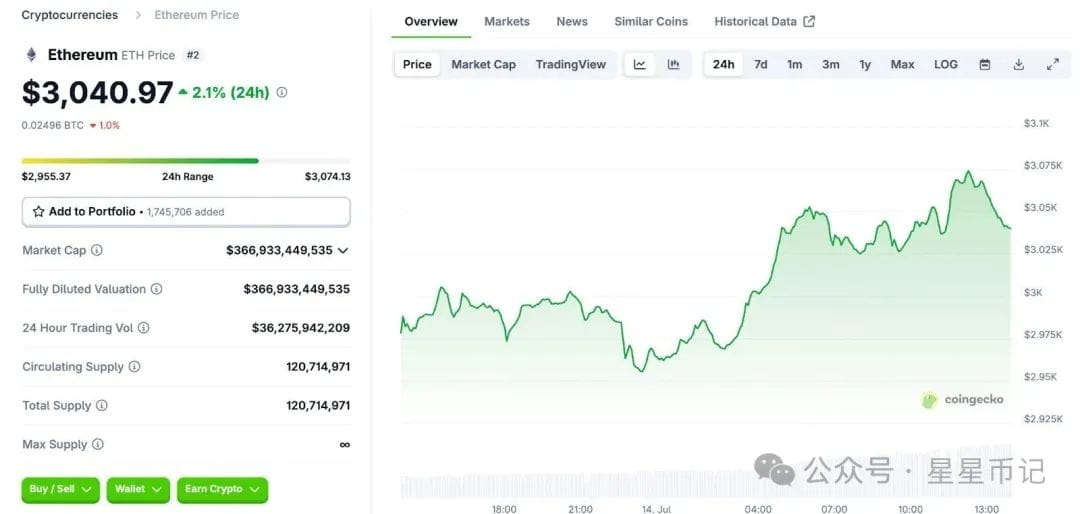
Ethereum ($ETH) rebounded, breaking through the psychological barrier of $3,000, rising about 2.13% in the past 24 hours, and currently trading at $3,028. This represents a 19% increase over the past week, with ETH's trading volume remaining well above $30 billion, reflecting optimistic sentiment across the cryptocurrency market.
Market sentiment is firmly in the greed zone, reflecting a bullish mentality among investors.
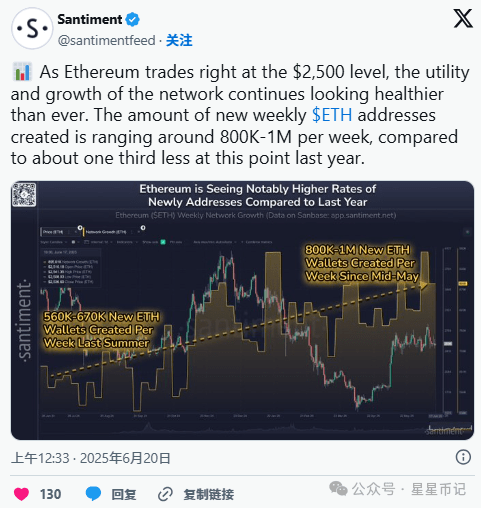
Demand for Ethereum network institutions has surged, with record network growth
Ethereum ($ETH) continues to consolidate its dominance in the decentralized finance space, with total locked value (TVL) on DeFiLlama reaching $74.4 billion. This indicates sustained demand for on-chain lending, staking, and trading activities on the leading smart contract network.
Meanwhile, the number of daily active ERC-20 addresses has reached 414,706, reflecting strong user engagement with Layer 1 and Layer 2 solutions.
As of July 12, 2025, the number of independent Ethereum wallets has reached 327.97 million, a year-on-year growth of 20%. The emergence of new wallets is seen as a sign of increasing interest from traders and developers in Ethereum.
The trading volume on decentralized exchanges also reached $1.71 billion within 24 hours, with protocol revenue exceeding $2.11 million, demonstrating strong market participation.
Moreover, institutional interest in $ETH is on the rise. The inflow of U.S. spot Ethereum ETFs has ranked second in recent months, reflecting stable institutional demand.
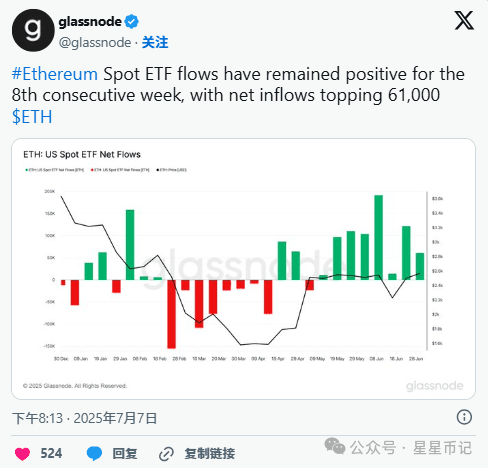
Following the U.S. Securities and Exchange Commission (SEC) approving spot ETF options trading in April to enhance trading flexibility, corporate balance sheets are now starting to increase $ETH.
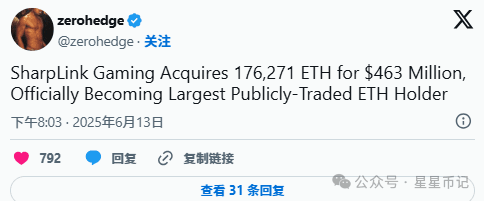
NASDAQ-listed SharpLink Gaming has accumulated $270,000 in ETH, surpassing the Ethereum Foundation, yielding $81.8 million in unrealized gains.
Market sentiment remains bullish, recently holding above $3,000, which aligns with expectations of further capital inflows and an increase in corporate balance sheets.
Ethereum paused after a bullish breakout, and the market is weighing the next move.
Earlier this week, Ethereum ($ETH) broke through a bullish triangle flag structure, currently trading at around $3,028.
This pattern formed after several days of consolidation, with prices hovering between converging trend lines before finally breaking through $3,030. However, this breakout has yet to accelerate into sustained upward movement. Instead, ETH is consolidating below the breakout area.
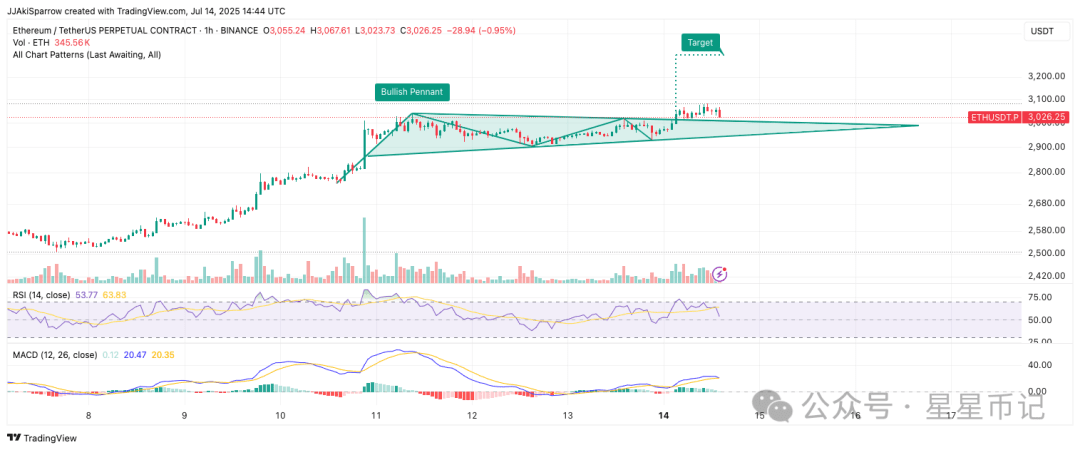
Recent pullbacks have been relatively small. The RSI is around 54, indicating that the market is in a neutral position with no signs of overbought or oversold conditions. The MACD indicator remains above the signal line, but momentum indicators are starting to flatten. Overall, these indicators suggest the market is currently in a wait-and-see mode.
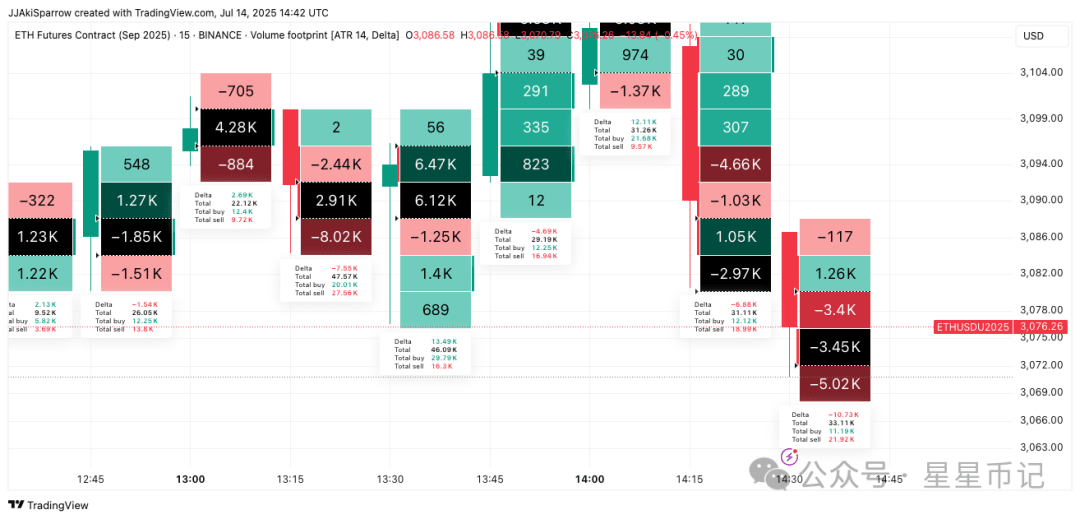
$ETH futures contract volume data indicates a shift in order flow. Initially, buy imbalances dominated, particularly around $3,085 and $3,092.
Subsequently, especially in recent candlestick charts, aggressive selling sentiment has returned. Larger negative Delta values, particularly around $3,076, indicate that some traders are selling risk or establishing new short positions using the post-breakout range.
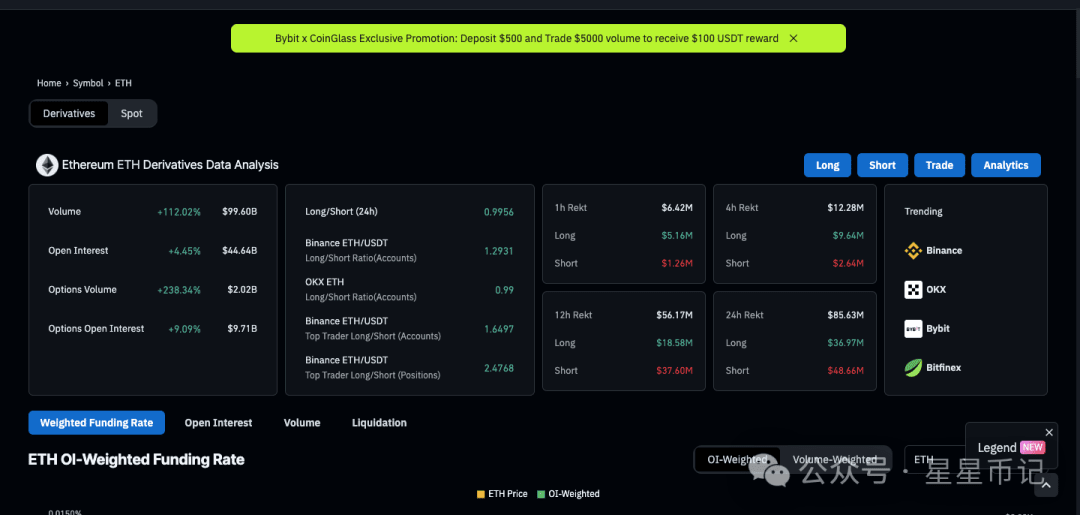
Additionally, speculative activity in Ethereum has surged sharply. CoinGlass data shows Ethereum trading volume increased by 112% to $99.6 billion, with open interest slightly rising to $44.6 billion.
Options trading activity has also surged, increasing by 238% to over $2 billion. The long-short ratio is balanced at 0.9956, indicating a lack of directional judgment in the market. However, the positions of top traders on Binance and OKX still lean towards bullish, with a ratio above 2.4.
ETH is currently at a critical level. If ETH can break through $3,100, it may rejuvenate bullish momentum and validate the effectiveness of the triangle flag breakout, thereby opening the way to a target near $3,250. On the other hand, if it falls below the ascending trend line, it may signal the failure of the pattern, refocusing market attention back to the $2,880-$2,900 range.
