🗓️ July 14, 2025 – 09:46 AM (UTC)
📍 Source: Binance BTC/USDT Chart
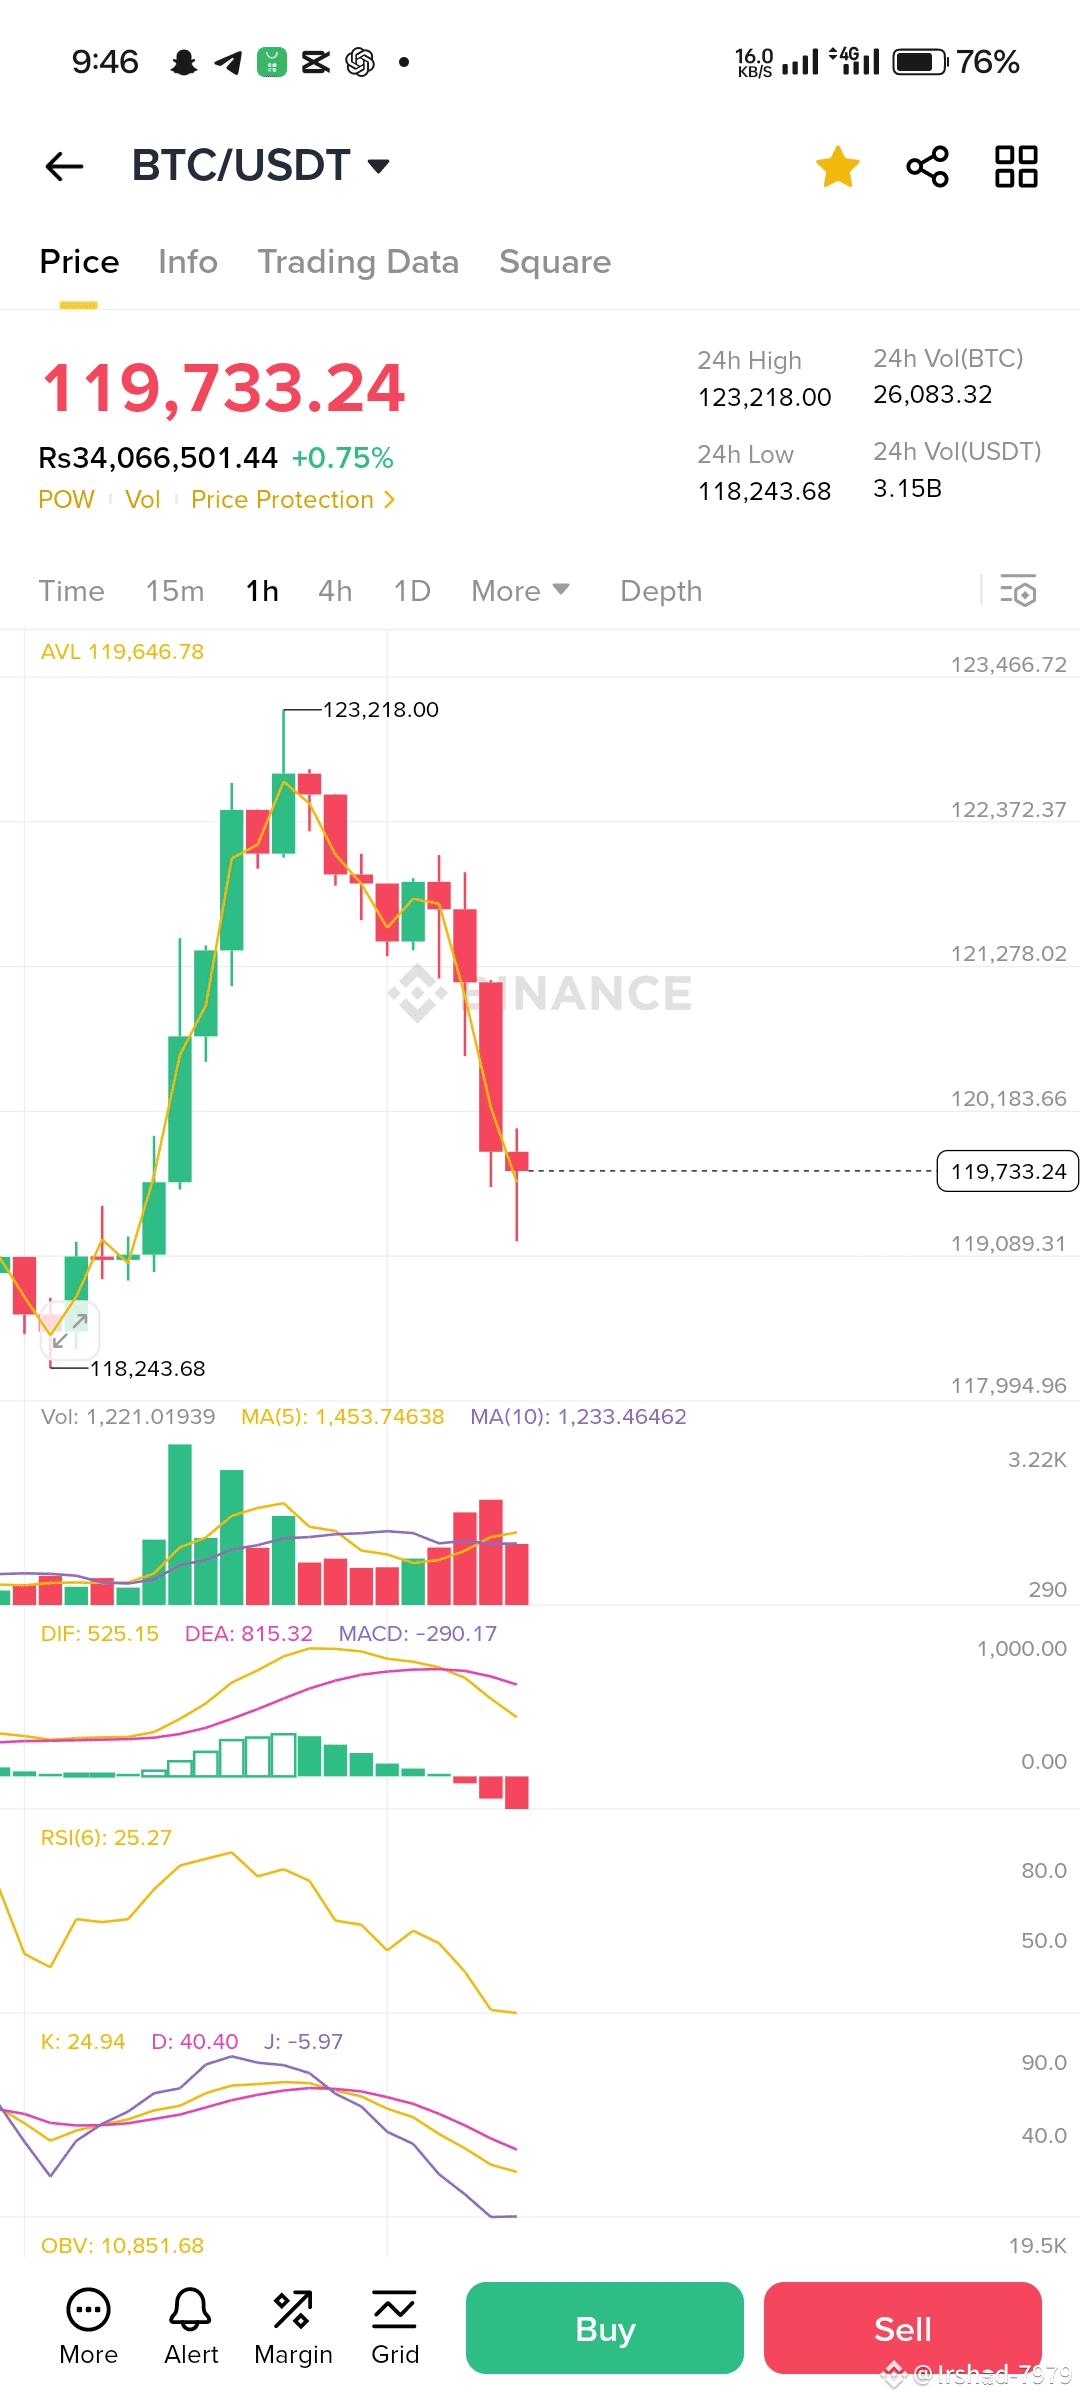
Bitcoin $BTC (BTC) has pulled back to $119,733.24, registering a 0.75% increase in the last 24 hours after briefly touching a high of $123,218.00.
🔻 Despite the positive daily gain, short-term indicators show bearish momentum on the 1-hour chart, with a steep decline from the recent peak and a dip toward the 24h low of $118,243.68. The Moving Average Convergence Divergence (MACD) is deeply in negative territory at -290.17, while the RSI(6) has fallen to 25.27, indicating an oversold condition.
📊 Technical Highlights:
24h Range: $118,243.68 – $123,218.00
Volume (24h): 26,083.32 BTC / 3.15B USDT
MACD: Bearish divergence continues
RSI: Approaching oversold level
Stochastic (K/D/J): All indicators trending downward
🔍 Market Sentiment:
Traders are eyeing key support around $118,000, while resistance remains strong at $123,000. If the RSI and volume suggest a bounce, a short-term reversal might be on the horizon.
📣 Stay tuned to Binance Square for the latest market updates and technical analysis.
#BTC #Binance #CryptoMarket #BitcoinUpdate #TechnicalAnalysis