Bitcoin continues to break out, setting a new all-time high as it temporarily surpasses the $121,000 mark before a slight correction and stabilization around $120,500. With a 2.54% increase for the day, this cryptocurrency is extending an impressive upward streak that began at the start of the month. However, the big question now is: Will the upward momentum continue, or is Bitcoin approaching a cooling point?
Investors have not yet taken profits
The adjusted Spent Output Profit Ratio (aSOPR) is currently at 1.03 – significantly lower than at the beginning of July 2025, when profit-taking activity surged, causing this index to spike. However, unlike before, even though Bitcoin has just set a new price peak, the market this time records a holding sentiment rather than selling.
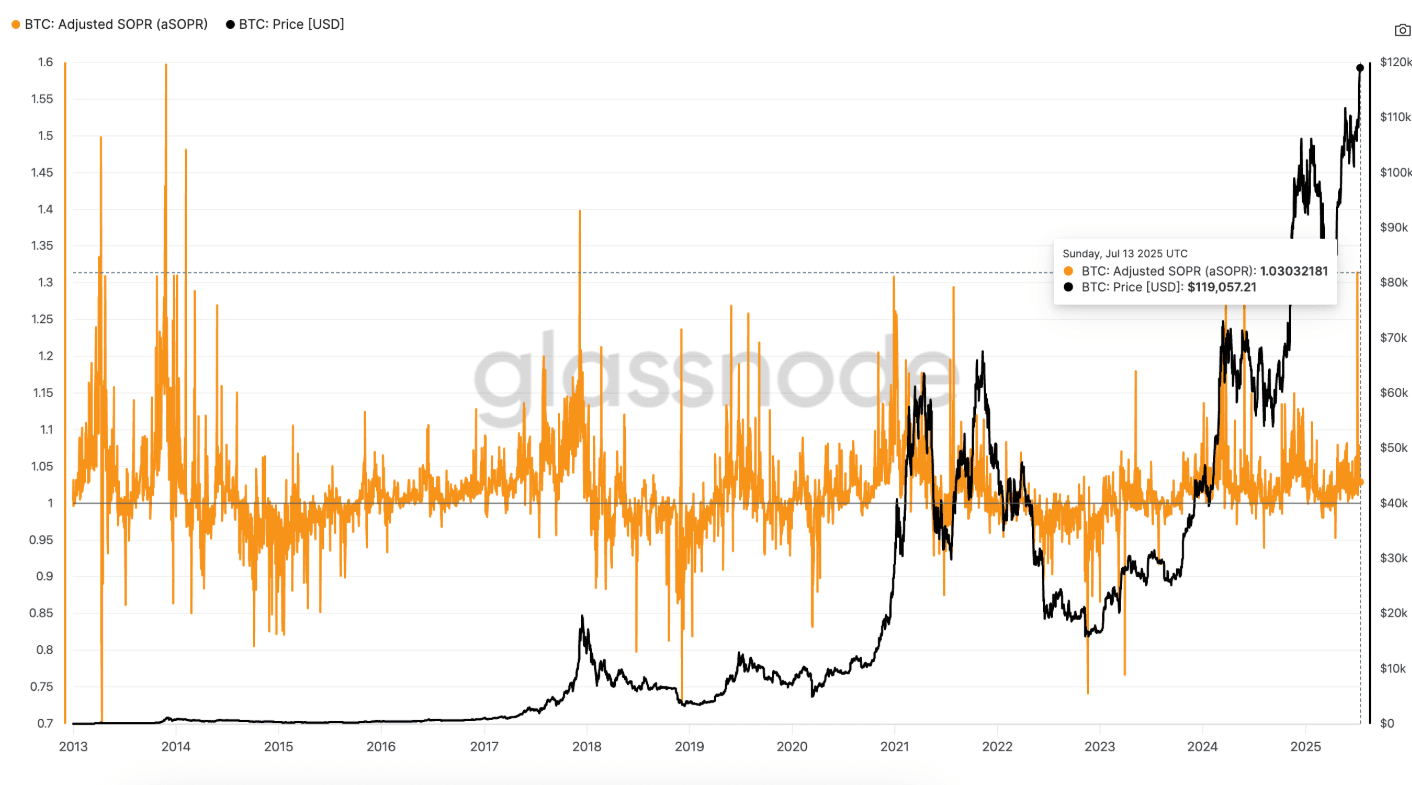
This indicates that most of the BTC circulating on-chain is not aimed at short-term profit-taking, reflecting that the current upward trend is still healthy and not 'overheated'.
Essentially, SOPR is an index that measures whether Bitcoin is being transferred on-chain at a profit (value above 1) or at a loss (value below 1). The adjusted version aSOPR – has been modified to eliminate short-term and internal transactions, aiming to provide a clearer picture of the actual profitability of on-chain transactions.
Trading volume is supporting the upward trend
The On-Balance Volume (OBV) indicator – also known as the balance volume – is rising in parallel with Bitcoin's price, indicating that buying pressure is still strong and closely following the current upward momentum. There are no signs of divergence or weakening momentum, which is a major plus for the current trend.
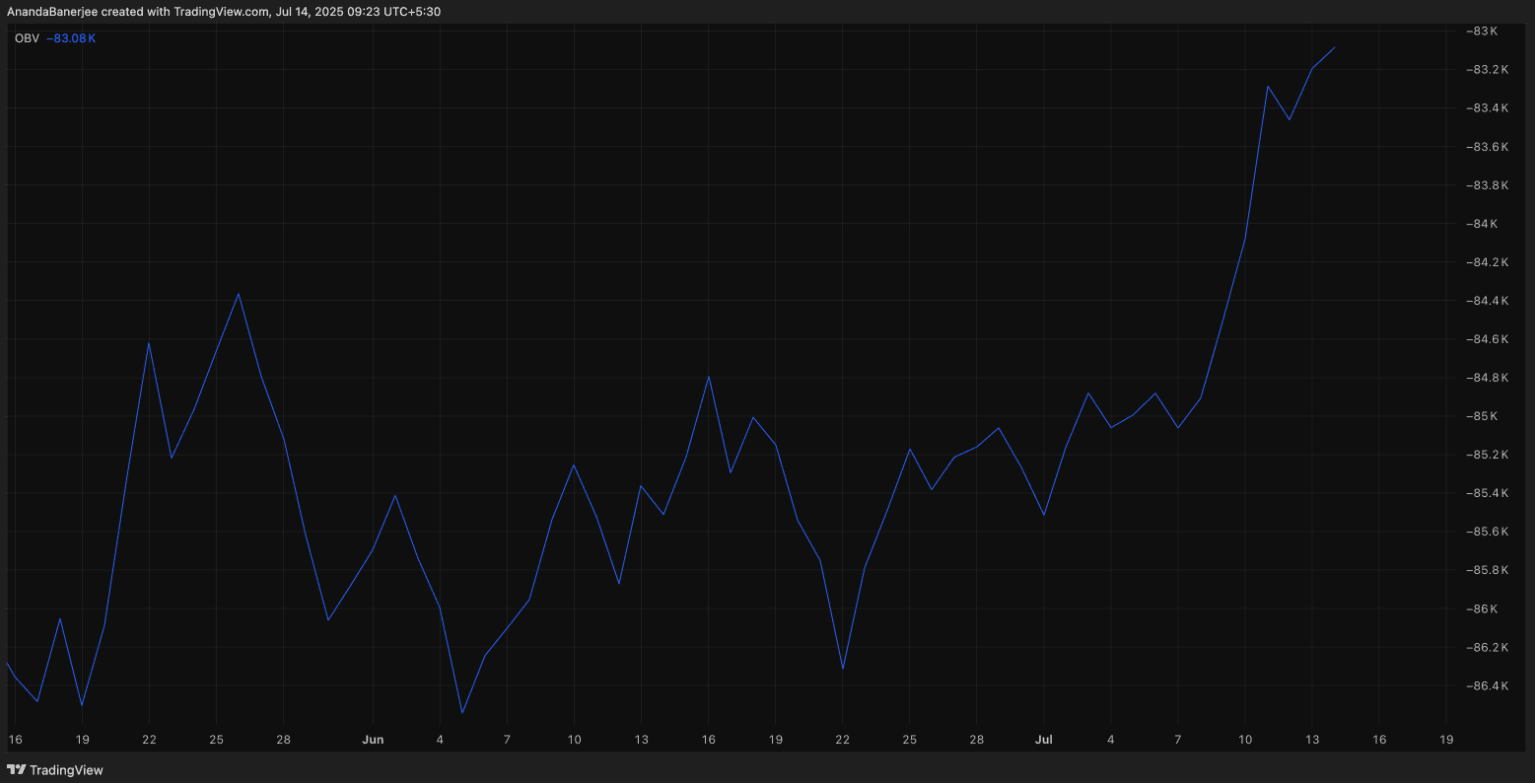
In other words: the price of Bitcoin is rising, and trading volume is also increasing – a strong consensus from the market.
OBV is an indicator that measures accumulated buying and selling pressure based on the direction of daily trading volume. When this indicator moves in the same direction as the price, it is a positive signal reinforcing the upward trend.
BTC price structure and next levels
Currently, Bitcoin is trading just below the $121,519 threshold – an important resistance level determined by the Fibonacci indicator's extension levels. If BTC can close above this mark, the next potential targets will be $127,798 and $135,425 – long-term forecast levels based on price behavior in previous trends.
The Fibonacci extension levels are determined through three key points: the bottom, the top, and the correction point. This allows for predicting potential resistance levels as the market continues its upward trend.
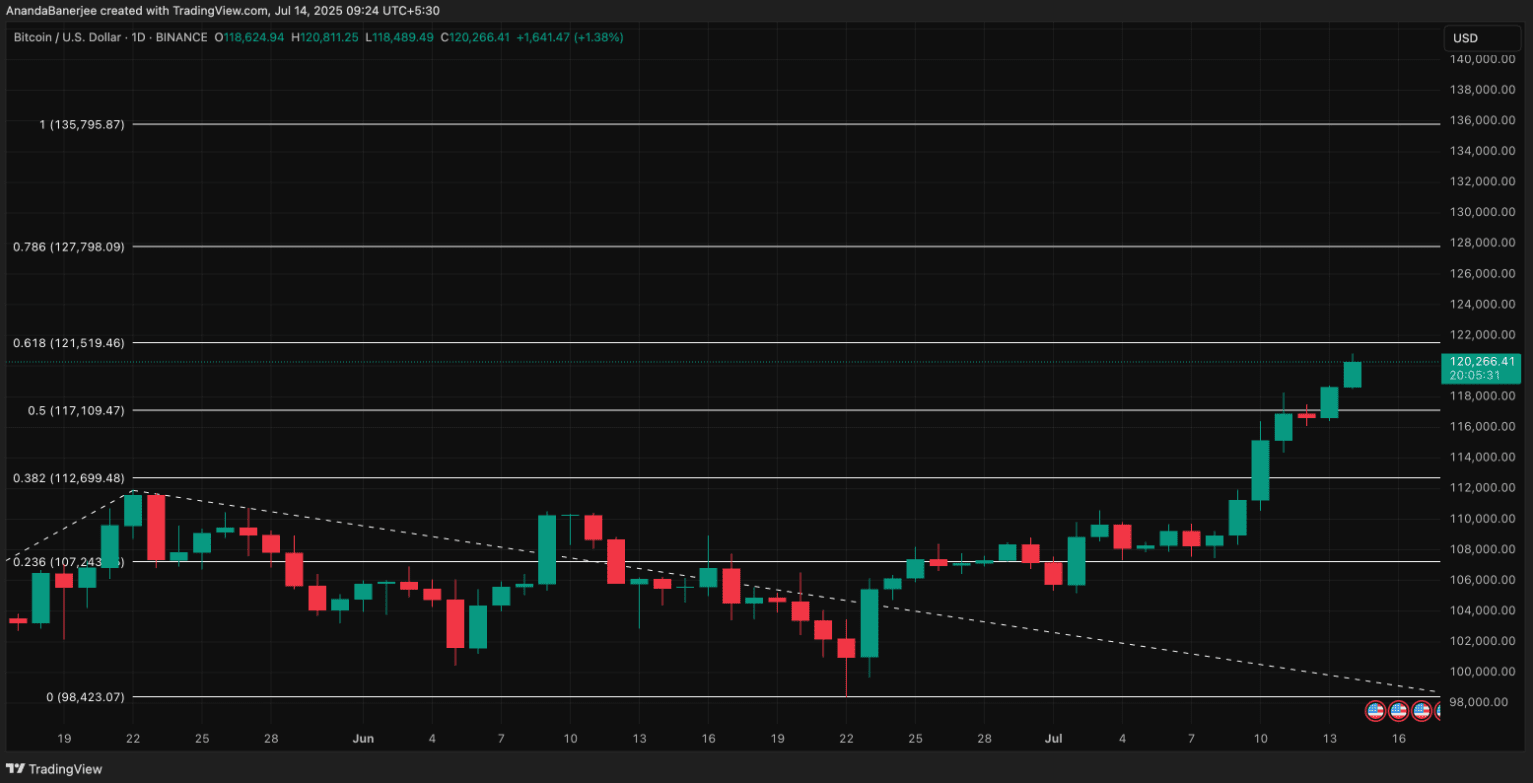
In the scenario of BTC reversing for a correction, the nearest support area will be around $117,109 – a region that previously witnessed a strong breakout. If the price drops below $112,699, this will be a noteworthy warning signal, as this is an important support level associated with Bitcoin's first historical peak. Especially, if the inflow of funds into exchanges surges or the SOPR index spikes, it could reflect significant profit-taking activity by investors – a factor that could trigger a deeper correction, potentially reversing the current trend.
