Technical analysis (TA) is a key element of successful trading in the cryptocurrency market. One of the most important tools of TA is the ability to recognize and use graphic patterns. These patterns help traders predict the price movement of an asset, determine entry and exit points, and evaluate potential reversals or continuation of the trend.
What are graphic patterns?
Graphic patterns are repeating formations on price charts that reflect market behavior and trader sentiment. They form as a result of price dynamics and allow predicting the likely direction of an asset's movement. Patterns are divided into two main types:
Reversal patterns – signal a trend change (from bullish to bearish or vice versa).
Continuation patterns – indicate the continuation of the current trend.
For day trading, patterns are particularly valuable as they allow quick responses to market changes. The choice of timeframe (e.g., 15-minute or 4-hour) affects how patterns are used: short-term for quick trades, long-term for swing trading.
How do patterns differ in the cryptocurrency and stock markets?
Although the cryptocurrency market is more volatile than the stock market, graphic patterns remain universal. The basic principles of their formation and interpretation are the same for both markets. By learning to recognize patterns in the crypto market, you can apply this knowledge to stocks, forex, or other markets. The difference lies only in the speed of price movements and trading volumes, which in the crypto market can be more impulsive.

Main categories of graphic patterns
1. Reversal Patterns
These patterns signal a trend change and are divided into:
Bullish reversal patterns – indicate the beginning of a price increase (signal to buy).
Bearish reversal patterns – indicate the beginning of a price decrease (signal to sell).
Popular reversal patterns:
Double top/bottom
Cup with Handle
Rounded Bottom
Diamond
2. Continuation patterns
These patterns confirm that the current trend will continue. They are also divided into:
Bullish continuation patterns – signal to buy.
Bearish continuation patterns – signal to sell.

Popular continuation patterns:
Triangles (ascending, descending, symmetrical)
Rectangle
Wedge (ascending, descending)
The most common graphic patterns and strategies for their use
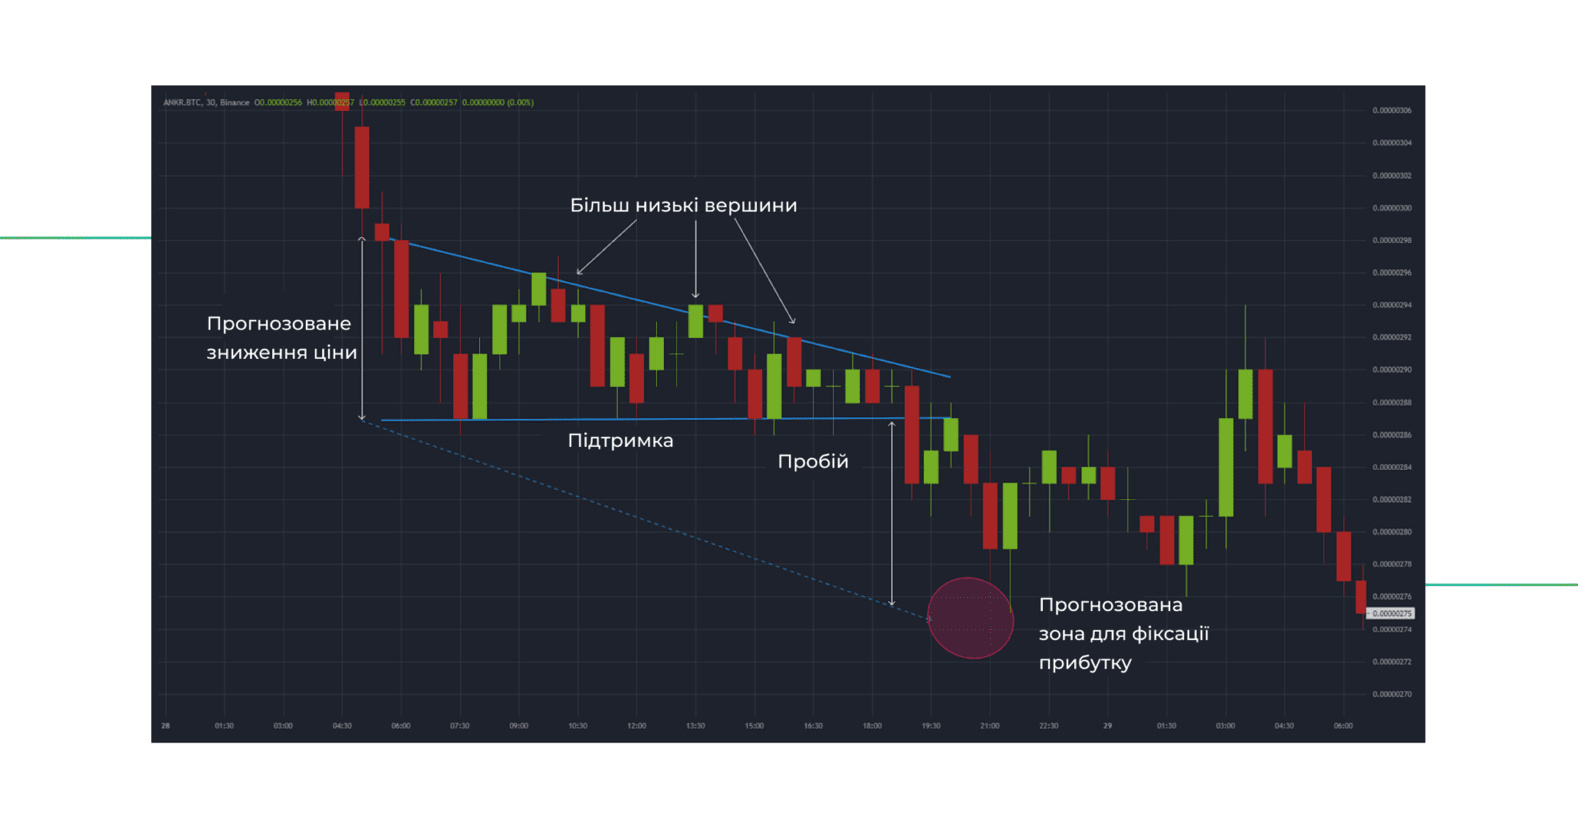
1. Pattern “Triangle”
Triangles are among the most common continuation patterns. They indicate reduced volatility before a breakout, which usually confirms the continuation of the trend. There are three types of triangles:
a) Ascending triangle (bullish)
Description: Formed by two higher lows and a horizontal resistance line. Signals the continuation of a bullish trend.
Trading strategy:
Wait for the breakout of the resistance line.
Entry into long position after the breakout.
Target profit: add the height of the triangle (from the lowest low to the resistance line) to the breakout point.
Stop-loss: below the nearest minimum.

Example: On the BTC/USDT chart, an ascending triangle forms with resistance at $40,000. The height of the triangle is $2,000. After the breakout, the target profit is set at $42,000.
b) Descending triangle (bearish)
Description: Formed by horizontal support line and lower highs. Signals the continuation of a bearish trend.
Trading strategy:
Wait for the breakout of the support line.
Entry into short position after the breakout.
Target profit: subtract the height of the triangle from the breakout point.
Stop-loss: above the nearest high.
Example: On the ETH/USDT chart, a descending triangle with support at $2,000 and a height of $200. After the breakout, the target profit is $1,800.
c) Symmetrical triangle (neutral)
Description: Formed by two converging lines (higher lows and lower highs). It can signal either a bullish or bearish breakout depending on the previous trend.
Trading strategy:
Wait for a breakout in the direction of the previous trend.
Entry into position after the breakout.
Target profit: height of the triangle from the breakout point.

Example: On the BTC/USDT chart, a symmetrical triangle after a bullish trend with a height of $1,500. A breakout upwards gives a target profit of $41,500.
2. Pattern “Rectangle”
Description: The price moves between two horizontal lines (support and resistance). Signals the continuation of the trend after a breakout.
Trading strategy:
Entry into position after breaking resistance (for a bullish trend) or support (for a bearish trend).
Target profit: height of the rectangle from the breakout point.
Stop-loss: 1-2% below/above the opposing line.

Example: On the XRP/USDT chart, a rectangle with support at $0.50 and resistance at $0.55. After breaking resistance, the target profit is $0.60.
3. Pattern “Diamond”
Description: Signals a trend reversal. Formed by expansion and then contraction of the price range, resembling a diamond. More often bearish, but can also be bullish.
Trading strategy:
Wait for a breakout of the lower line of the diamond (for bearish) or the upper (for bullish).
Target profit: height of the diamond from the breakout point.
Stop-loss: on the opposite side of the diamond.

Example: On the BTC/USDT chart, a bearish diamond at the market peak. The height of the diamond is $5,000. After the breakout downwards, the target profit is $50,000.
4. Double Top and Double Bottom
Double top (bearish):
Description: The price tests resistance twice, after which it breaks support, signaling a downward reversal.
Trading strategy: Entry into short after breaking support. Target profit is the height from resistance to support.
Double bottom (bullish):
Description: The price tests support twice, after which it breaks resistance, signaling an upward reversal.
Trading strategy: Entry into long after breaking resistance. Target profit is the height from support to resistance.

Example: On the BTC/USDT chart, a double bottom at $41,000 with resistance at $44,500. After the breakout, the target profit is $48,000.
5. Pattern “Cup with Handle” (bullish)
Description: U-shaped form (cup) with a short downward movement (handle). Signals a reversal of a bullish trend.
Trading strategy:
Entry into long after breaking the handle.
Target profit: depth of the cup from the breakout point.
Stop-loss: below the minimum of the handle.

Example: On the ETH/USDT chart, a cup with a depth of $9,000. Breaking the handle at $40,000 gives a target profit of $49,000.
6. Pattern “Rounded Bottom” (bullish)
Description: U-shaped form without a handle, signaling a reversal of a long-term bearish trend.
Trading strategy:
Entry into long after breaking the neck line.
Target profit: depth of the pattern from the breakout point.
Stop-loss: below the nearest minimum.

Example: On the BTC/USDT chart, a rounded bottom with a depth of $6,000. A breakout at $40,000 gives a target profit of $46,000.
7. Pattern “Wedge”
Ascending wedge (bearish):
Description: Higher highs and lows converging. Signals a reversal of a bullish trend or continuation of a bearish one.
Trading strategy: Entry into short after breaking down. Target profit is the height of the wedge.
Descending wedge (bullish):
Description: Lower highs and lows converging. Signals a reversal of a bearish trend or continuation of a bullish one.
Trading strategy: Entry into long after breaking up. Target profit is the height of the wedge.

Tips for effective use of graphic patterns
Confirmation of signals: Always use additional indicators (RSI, MACD, volumes) to confirm the breakout.
Risk management: Set stop-losses to limit potential losses.
Testing on historical data: Before applying a strategy, test it on a demo account.
Avoid overload: Do not try to find patterns where there are none. Clarity is the key to success.
Use different timeframes: Analyze patterns on multiple timeframes for a more accurate forecast.
Conclusion
Graphic patterns are a powerful tool for crypto traders that allows predicting price movements and making informed trading decisions. From triangles and rectangles to diamonds and rounded bottoms – each pattern has its own characteristics and application strategies. By using the Good Crypto platform, you can easily draw and analyze these patterns, increasing your chances of success.
Practice recognizing patterns, follow risk management, and continually improve your skills. The crypto market is full of opportunities, and graphic patterns are your compass in the world of volatility! 🚀
