25/07/13 BTC approaches 120,000, the bull does not speak of peaks and acts according to the trend, altcoins rebound one after another.
In a bull market, one does not speak of peaks or short the market. Bitcoin continues to set historical highs, and all shorts have become fuel. The individual has always been a die-hard bull. BTC will always oscillate upwards, always bullish, always teary-eyed. I wonder what the mentality is of those who short BTC at the slightest pullback? Especially those who short expecting a collapse? Did you enter the crypto space seeing the future trend of blockchain, believing in Bitcoin's disruption of traditional finance, or did you join because you heard about a friend's financial freedom? If you have no faith in BTC, there's no need to mention anything else.
MicroStrategy's Bitcoin holdings have made an unrealized profit of approximately $28 billion, and more and more listed companies, like the Japanese version of MicroStrategy, are purchasing, often in tens of millions to billions of dollars. Do you think they are just naive with too much money? Would they easily choose without in-depth research? I may not influence many people, but I hope to see the analysis inspire some individuals for mutual encouragement!
Historically, BTC takes an average of about 53 weeks after the US elections to reach a cycle peak, with only 17 weeks left, indicating a peak around the end of November to December. The BTC power law corridor indicator is currently below the midline, and if it breaks upwards, it will enter an accelerated cycle. If it breaks to the upper line, the price will be around 200,000, based on historical trends analysis.
The traditional four-year bull and bear cycle may be broken. The bull market pattern has shifted from the past 'impulsive surges' to a more sustainable wave upward, with the market trend becoming milder. Unlike the liquidity bubble bull market driven by the ICO craze in 2017 and the Grayscale fund in 2020, the current market relies more on value-driven and stable allocation of institutional funds, suggesting that this bull market cycle may significantly extend, presenting a new pattern of 'long bull slow rise.'
The gold ETF has opened a ten-year bull market, and there are similar speculations about BTC spot ETF, but currently, there is not enough evidence to prove it. There is also a claim that BTC will reach the second place in the global asset market capitalization ranking, and everyone claims that BTC will soon surpass gold, which means it’s time to sell everything.
BTC
The structure of Bitcoin is a rounded bottom with a cup handle shape, recently breaking upwards from a head and shoulders bottom formation, with the weekly chart showing a historical highest K-line. The recent wave of bullish flags has risen proportionally to 135,000, and according to the Fibonacci extension line, 0.618 is 122,000, and 0.786 is 128,000. Pay attention to these two pressures.
In the short term, the 4-hour and 1-hour charts show a converging triangle with minor pullback, still having upward momentum. As long as it does not fall back to 112000, we continue to be bullish.
Support: 112000
Pressure: 122000 to 128000—135000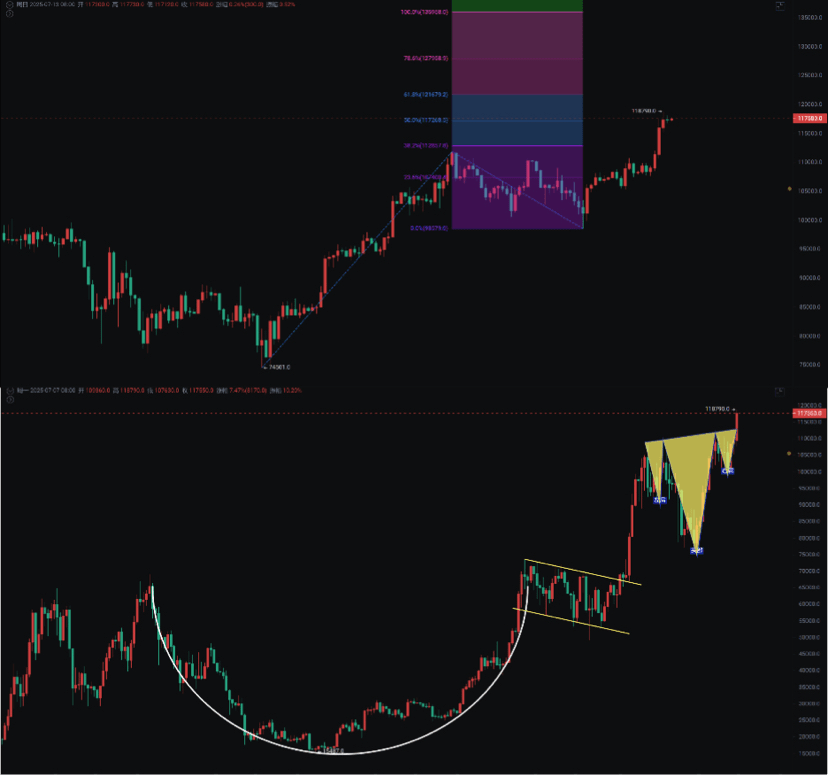
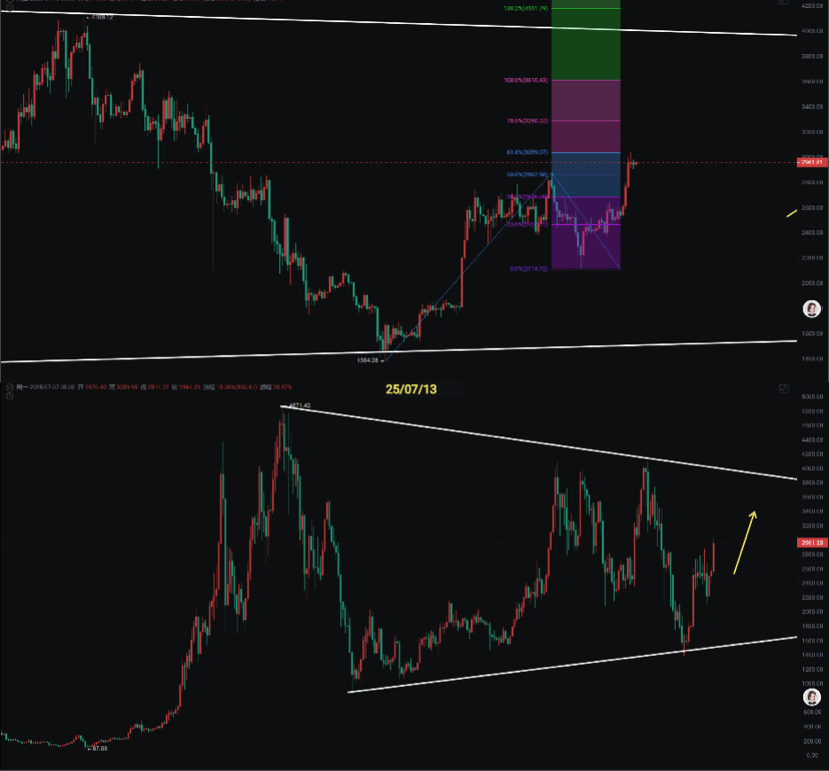
Ethereum
The overall idea remains unchanged from the previous days. The individual does not engage much in very short-term contracts but will pay attention to key turning points in the market and the mid-line wave.
The weekly chart has broken out of the box pattern with a three-wave structure continuing upwards. The first target is 3300, the second target is 4000, and we will see if the weekly level converging triangle can break out?
Support: 2800 to 2900
Pressure: 3300 to 4000