On 25/07/11, BTC broke new highs for two consecutive days, and ETH reached 3,000 dollars. The main upward wave of the bull flag has begun.
Bitcoin finally broke the new high, reaching a maximum of 118,900, and ETH reached 3,040. It is worth it that the gentleman has been bullish during this period; altcoins have basically taken off, and Bitcoin's bull flag has broken through and reached a new high.
So the next target for a proportional rise is 135,000, with the bull market peak expected between 180,000 and 250,000. The first target for ETH is 3,300 and the second target is 4,000. The peak of the bull market is unpredictable and mainly depends on whether the weekly level converging triangle can break through. If it breaks through, there is a chance to reach 8,000 to 10,000.
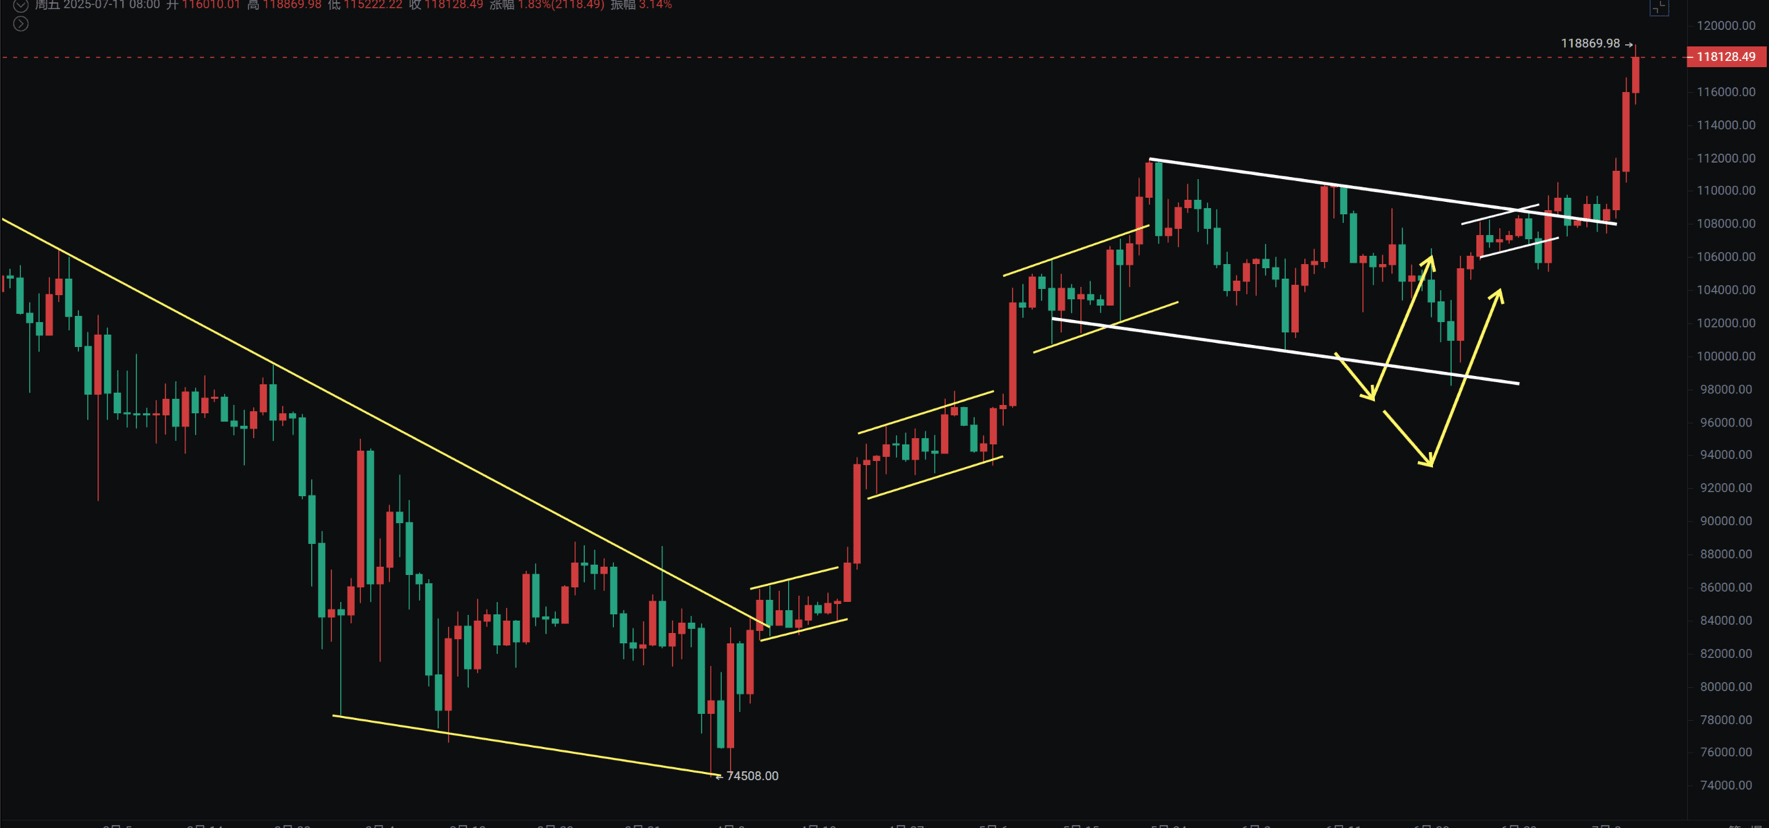
BTC
The BTC bull flag broke through after oscillating for four to five days at the upper edge, ultimately choosing to break upward. Therefore, as I told the gentleman, if the daily MA20 and 60 have not broken, there is still a chance to continue to be bullish. Currently, the MA20 and 60 have formed a duckbill pattern and have just broken the previous high, indicating that the trend will continue...
The gentleman held onto the long position after breaking the bull flag last year and currently has over 60% profit. Although the process has been torturous, the predicted trend is correct. The narrative of this bull market and institutional capital has completely changed. More and more listed companies are joining the ranks of regular investments in Bitcoin. Coupled with the increasing uncertainty in the global situation, gold has reached a temporary high point, including the need for a new reservoir of funds and hedging products in traditional financial markets, pushing Bitcoin to continuously reach new highs...
Support: 112,000
Resistance: None (temporarily looking at 135,000)
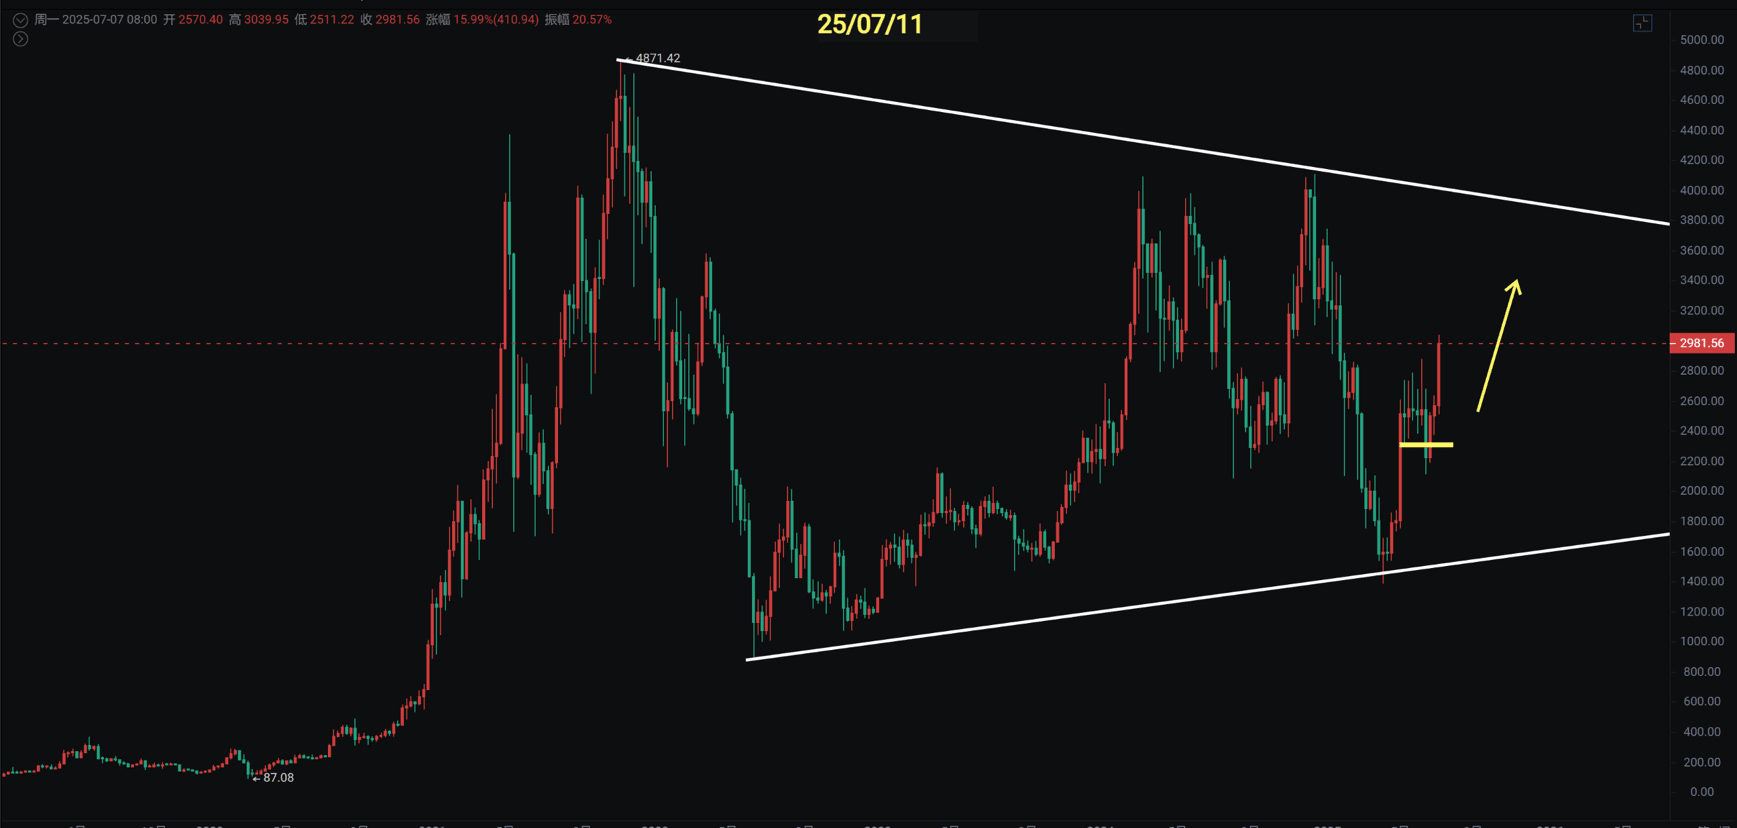
ETH
The entire operational logic of ETH is similar to what I mentioned before. Over the past two years, it often went through a few months of sideways movement at the bottom before entering a one-sided market. This wave is also the same; I have always said that the weekly chart shows a throwing brick to attract jade pattern, but it took more than a month to choose to break upward, extending the time cycle.
If the weekly chart rises from 4,800 in 2020, it is considered the first wave, and from 2021 to now is considered the second wave of a converging triangle. Therefore, it is still in the running of the second wave. When it breaks through, it may enter this one-sided market, so how long ETH will oscillate still needs to be observed. Unless it breaks through 4,100, there is a possibility of heading toward new highs and doubling.
Support: 2,879
Resistance: 3,300 to 4,100