
Written by: Jose Antonio Lanz, Guillermo Jimenez
Compiled and organized by: BitpushNews

Bitcoin continues to strongly break through key resistance, standing at a historic high of $116,000. This breakout trend injects new momentum into the market, and the focus of traders will be how high it will reach next; this article will break it down from a technical chart perspective.
Macro background preparation
As the S&P 500 and Nasdaq Composite Index close at historic highs for the third time in four trading days, and gold futures rise above $3,370 per ounce, risk assets are receiving broad buying support as the Federal Reserve maintains a patient stance on monetary policy.
Bitcoin's upward momentum is also resonating with surging U.S. employment data—June's non-farm payrolls rose by 147,000 (expected 110,000). Despite the strong employment data initially causing Bitcoin to drop below $109,000 due to rate hike concerns, the market quickly absorbed the selling pressure and pushed it to a local new high.
Institutional adoption remains the core driving force. In July, Bitcoin ETF cumulative inflows have surpassed $50 billion. This sustained institutional buying provides critical support for any pullback and validates Bitcoin's evolution from a speculative asset to a portfolio allocation asset.
The synergy between technical breakthroughs and institutional accumulation leads traders to ponder: after overcoming the last barrier to the unknown, where will Bitcoin go next?
Bitcoin chart: Double breakout targeting final resistance
Bitcoin recently surged to $113,000, marking the opening of a new historic high area, which is also a decisive technical breakout from two formations that had suppressed prices for weeks.
The 4-hour chart shows Bitcoin cleanly breaking out of a symmetrical triangle formation, while the daily chart shows smaller fluctuations, with bullish momentum appearing slightly insufficient; this is expected in such patterns, but the length of the candlestick leaves little doubt. The breakout confirmation is clear—sufficient for nearly all key indicators to turn bullish within the daily timeframe.
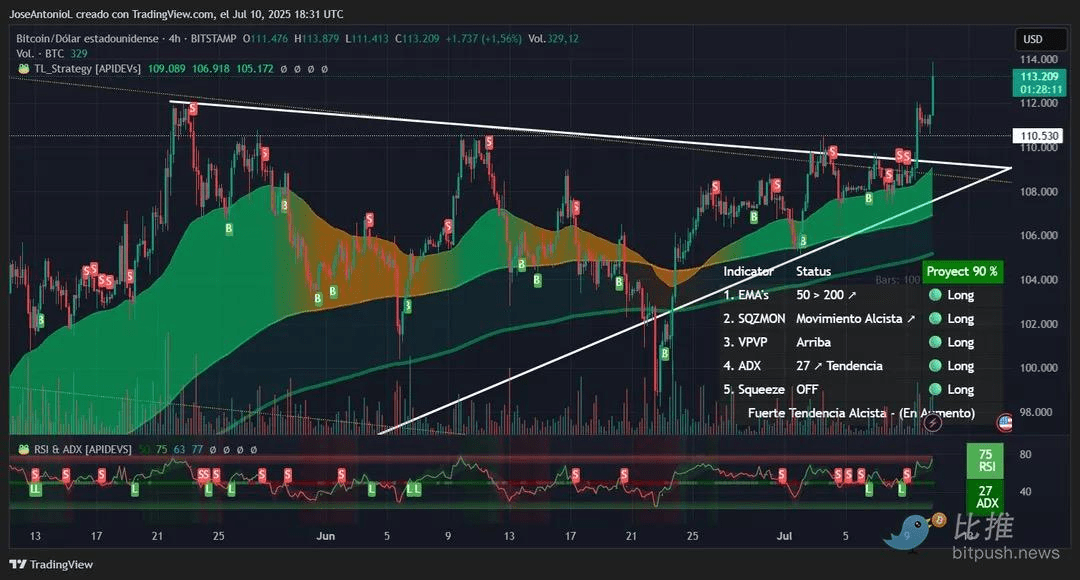
Chart source: TradingView
On the 4-hour chart, the Average Directional Index (ADX) is at 27. This typically confirms a trending market. The ADX measures trend strength without considering direction; when it breaks 25, it signals momentum traders that a sustainable trend is forming, often triggering systematic buying from trend-following strategies.
However, the Relative Strength Index (RSI) at 75 shows that Bitcoin has entered the overbought territory. One might view the RSI as a market thermometer—when readings are too high, it often indicates a cooling demand. The current situation may suggest an impending adjustment after a significant rise. However, it is worth noting that Bitcoin has maintained bullish momentum even at higher RSI levels.
The squeeze momentum indicator on the daily chart shows a 'close' status, indicating that the volatility released from the recent compression aligns with previous analytical expectations. This suggests that the initial breakout has been realized, and traders should prepare for a continuation of the upward trend or consolidation at current levels.
Overall, the price is releasing bullish signals. Despite a higher probability of continuation in the upward trend, given that pullback candlesticks generally show small fluctuations, adjustments are not expected to pose a threat to the trend.
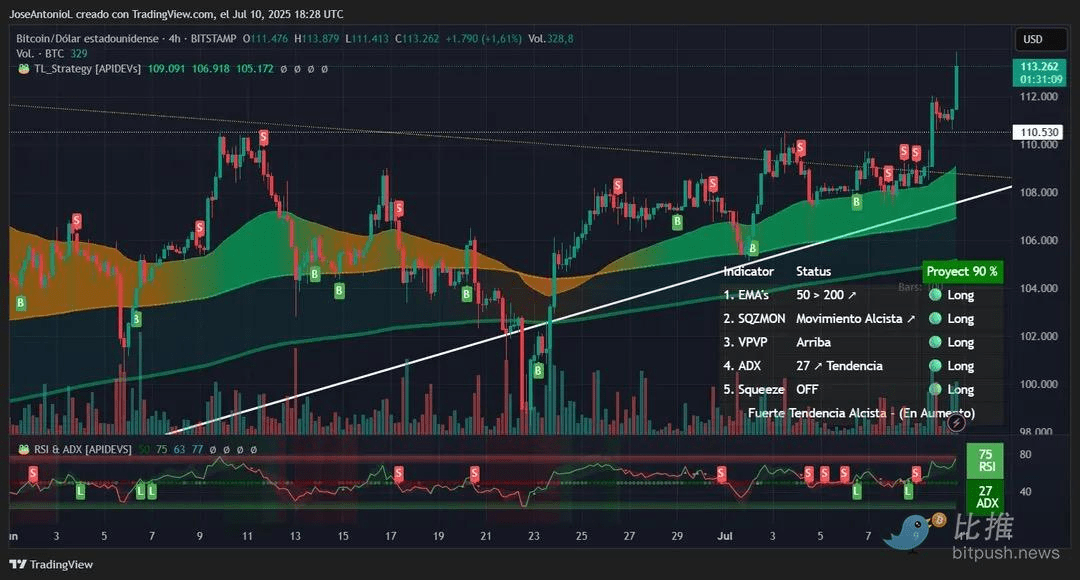
The daily chart also displays a bullish structure: Bitcoin has broken free from the descending bearish channel that has suppressed prices since May's peak (marked by the yellow line above). It appears to be forming a bullish support line (marked by the white line above), referencing the April pullback low and the late June low. If confirmed, Bitcoin may oscillate near this support line, maintain bullish momentum, and establish $110,000 as new support before the end of the month.
The daily chart shows an RSI of 67, indicating healthy momentum and not reaching the overbought region above 70—suggesting further upward space. This reading informs traders that buying pressure remains strong, but has not yet reached the extreme levels typically indicative of an adjustment.
The daily ADX at 12 indicates that the trend is still developing and has not yet reached a level that can be defined as a clear dominant pattern—short-term charts often contain a lot of noise. Although it is below the key threshold of 25 for confirming strong directional movement, low readings after a breakout often indicate calm before acceleration. Traders interpret this as an accumulation phase before the next wave of impulsive upward movement.
Moving average analysis shows that Bitcoin is steadily positioned above the 50-period and 200-period Exponential Moving Averages (EMA) across multiple time frames. The continually widening gap between these moving averages (known as moving average divergence) typically indicates a strong trend state and acts as dynamic support during pullbacks.
Key price levels
Immediate support: $110,197 (breakout retest level)
Strong support range: $105,000-$108,700 (support line)
Expected resistance: $115,000 (based on triangle breakout measured target and Fibonacci extension)
Bitcoin market outlook
The synergy of technical breakthroughs, institutional fund flows, and a favorable macro environment is driving Bitcoin's potential to continue its bullish trend after breaking historical resistance. However, traders who prefer technical analysis should monitor whether the daily ADX can break 25 to confirm trend strength while remaining vigilant of RSI top divergence when new highs fail.
Looking at the broader picture, Bitcoin may still experience significant volatility in July: policies like the Trump administration's 'Great Beautiful Plan' could expand the U.S. deficit by $3.3 trillion—historically this is favorable for scarce assets like BTC. Additionally, the deadline for the White House's cryptocurrency executive order report on July 22 is approaching, which may involve updates on the U.S. strategic Bitcoin reserves and could serve as a potential catalyst.

