Don't enter the cryptocurrency circle with this mentality. If you have this mentality, you have already lost.
A friend brags that you are a cryptocurrency player. If you can't even get a single coin, how can you say you are a cryptocurrency player?
Hoarding coins is the end.
The cryptocurrency world cannot make you rich overnight, but learning the skills well can make you gain a lot in the cryptocurrency world.
My thoughts, I wish every friend who reads Lele’s article will become rich in 2024! Looking forward to 2025!
If you are new to the cryptocurrency world, you need to remember these most effective trading tips
1. Buy horizontal and pits instead of vertical, the selling point is at the peak;
2. Continuous small increases are real increases, while continuous large increases require exiting the market;
3. If the price rises sharply, it will fall back. Don’t buy too much unless you dig a deep hole.
4. The main rise is about to peak, so sell quickly when the price drops sharply and sell slowly when the price rises slowly;
5. A sharp drop without volume is a threat, a slow drop with large volume is a sign of haste;
6. When the price breaks through the lifeline, do not hesitate to trade in waves;
7. Look carefully at the daily and monthly lines, and follow the main force to build positions;
8. The price of the currency is rising but there is no volume. The main force is tempting to buy more and don’t stand guard;
9. The new low with shrinking volume is the bottom image, and the incremental recovery is to enter the market; the simpler things in the currency circle are often the more effective, and all the formulas are
The crystallization of wisdom.
Learn these tips, remember them, and apply them in actual combat, which will definitely help you avoid many detours.
Application of technical indicators in trading
For the secondary market, we can also divide investment into Tao, Fa and Shu, and none of the three can be missing.
Tao: represents investment philosophy and investment beliefs, that is, the direction, goals and values of investment. It includes long-term market trends, macro conditions and
and fundamental analysis.
Law: represents the laws and rules of investment, including investment strategy, risk management, and asset allocation.
Techniques: Technical analysis, quantitative analysis, and trading psychology of investment
Today, this report will focus on the "technique" of trading. Its purpose is to share the application of technical indicators and technical analysis in actual combat.
For most people, there is no need to learn many technical indicators, because technical indicators are lagging and cannot directly make profits.
The report will share commonly used technical indicator methods to let more people know the significance of technical analysis.
Disclaimer: The currencies and indicators mentioned in this report do not constitute investment advice and are only for learning purposes.
Not applicable to all currencies and products. Blockchain is extremely risky and you may lose all your capital, so please do your own research.
The article mainly includes:
1. Explanation and application of MA and MACD+ indicators
2. Interpretation and application of Boll and RSI+ indicators
3. Flag Formation + Variation
IV. Conclusion
1. Explanation and application of MA moving average + indicators
MA indicator, also known as Moving Average, calculates the average price within a number, such as MA5.
Represents the average price of the candlestick chart for 5 time periods (including the current one), whether it is at the minute level, hour level, or day level. MA number
The smaller the MA number, the more sensitive the fluctuation is, and the more attention is paid to short-term fluctuations. On the contrary, the larger the MA number, the slower the fluctuation is, and the more attention is paid to long-term fluctuations.
fluctuations.
The MA number is set according to the user's preference. Here I share two sets of MA trading methods that I often use, namely Vegas Channel + and
The squeeze channel.
Vegas Pass
Vegas channel, its simplified explanation is to use 144, 169 moving averages, and use three moving averages to judge the medium and long-term supertrend. This method is not applicable
For cycles below 15 minutes, it is suitable for use in cycles above 1 hour.
Why use these two moving averages?
If we observe carefully, we can see that 144 and 169 are the squares of 12 and 13 respectively, which implies Gann's square theory and Fibonacci.
That is, the number 144 comes from Gann's square theory, and the number 169 is the square of the Fibonacci number 13. The two are combined together.
Only when it is used can it achieve better application effect in actual combat.
Explanation:
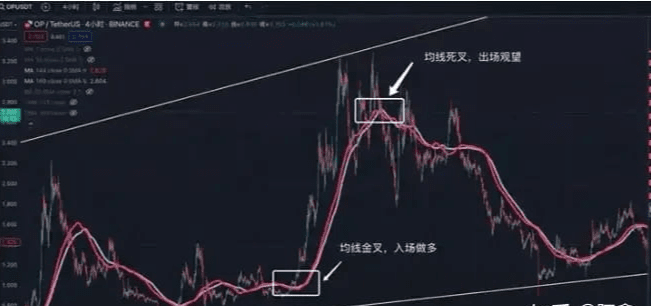
Taking the four-hour trend of 0P as an example, we found that when the 144-day moving average crosses the 169-day moving average, a golden cross is formed (the golden cross represents the 144-day moving average).
When the price reaches the top, the 144 moving average crosses the 169 moving average, which means medium- to long-term bullishness. You can try to enter the market. When the price reaches the top, the 144 moving average crosses the 169 moving average.
If a death cross is formed (a death cross means that the 144 moving average crosses below the 169 moving average), then the medium- and long-term exit is on the sidelines.
Then someone may ask, what you said is too absolute, how do you explain the golden cross and dead cross of the moving average before the sideways movement?
This is just gambling!
My suggestion here is that since the 144 and 169 moving averages cannot determine the short-term trend and have a strong lag,
We can add 7 and 14-day moving averages to help determine short-term trends.
By predicting medium- and long-term market changes and then reconfirming them through the golden cross of the small-level MA moving average, you can achieve the highest certainty.
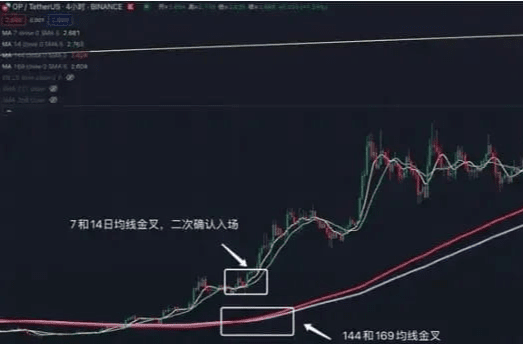
The Vegas channel is used to determine the medium- and long-term trend. Due to the lag of the Vegas channel, it still needs to be supplemented with the short-term moving average for verification.
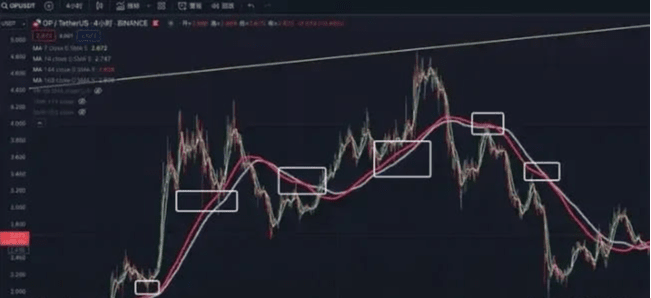
A strong market must reach the 144 and 169 moving averages. If the price moves sideways near the 144 and 169 moving averages, it indicates a short-term market.
At the same time, the 144 and 169 moving averages have good support and pressure effects, which are suitable for ultra-short-term oversold rebound operations.
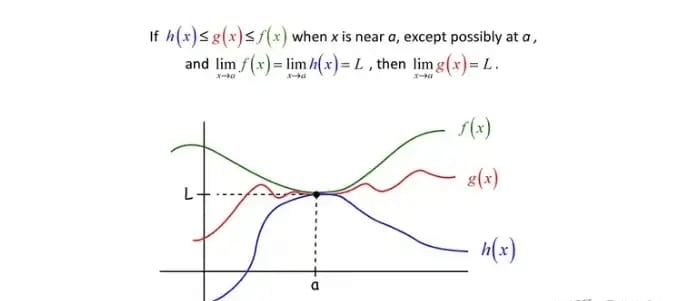
Squeeze channel Squeeze channel, mainly comes from the squeeze theorem in mathematical calculus, its simplified explanation
Yes, if a function is "sandwiched" by two other functions near a point, and the limits of these two functions are the same, then this
The limits of the function will also tend to the same value.
In the secondary market, we can also use a similar squeeze theorem model, and we can simplify two moving averages, namely 111 and
350 moving average. Since the 350 moving average has a longer period, it is recommended to use it in short-term trading.
Why these two moving averages?
Dividing the 350 moving average by the 111 moving average gives us a number that is closest to pi, which is 3.15, or we divide 350 by 3.14 and get
The closest number is 111.
Example explanation:
Let's take TRB's 1-hour trend as an example. When the blue line (350) moving average is above and the yellow line (111) moving average is below, a similar or approximate trend is formed.
When the triangle shape is formed, it means that the "squeeze" is successful. After success, the subsequent trend is bullish, but it should be noted that a correct "squeeze" shape
In this state, the 111 moving average must cross the 350 moving average. If only one side crosses, it is not true.
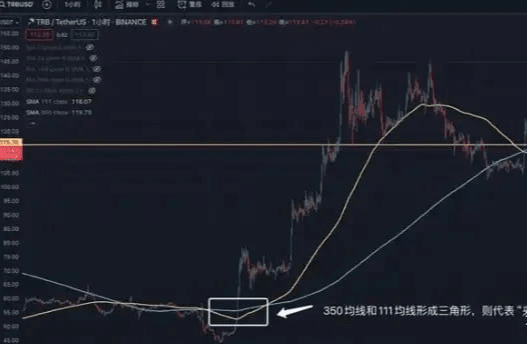
This channel is applicable to the 1-hour and 4-hour levels, but the accuracy is average. However, once successful, the subsequent trend will be a super-large-scale market.
Therefore, when a squeeze pattern appears, we can pay more attention and concern, and we can also use other technical indicators to assist in judgment.
MACD (Moving Average Convergence Divergence)
MACD (Moving Average Convergence and Divergence) is the most commonly used technical indicator in trading.
The core is to analyze the changes in price momentum by comparing moving averages of different periods, thereby providing buy and sell signals.
It is mainly divided into three types: mold line, MACD line and signal line, and three types of changes are mainly observed.
Three variations of MACD:
1. MACD line and signal line crossover:
Buy signal: When the MACD line (blue) crosses the signal line (yellow) from below, it means that the market momentum is turning positive and you can consider buying.
Buy long
Sell signal: When the MACD line (blue) crosses the signal line (yellow) from above, it means that the market momentum has turned negative and you can consider
Sell
2. The relationship between MACD line and zero line:
Above the zero line: When the MACD line is above the zero line, it means that the short-term average is higher than the long-term average and the market is in an upward trend.
Below the zero line: When the MACD line is below the zero line, it means that the short-term average is lower than the long-term average and the market is in a downtrend.
3. Changes in the histogram:
The bar chart changes from negative to positive: When the bar chart changes from negative to positive, it means that the MACD line is above the signal line, and the momentum is increasing, which is a good time to buy.
Incoming signal
The bar chart changes from positive to negative: When the bar chart changes from positive to negative, it means that the MACD line is below the signal line and the momentum is weakening.
Output signal
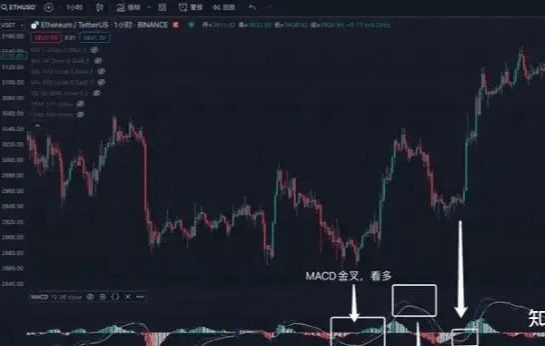
Example explanation:
Let's take ETH's 4-hour trend as an example. When the MACD line crosses the signal line, it means the market is bullish. When the signal line crosses the MACD line
At the same time, MACD is applicable to all time periods, whether long-term or short-term, whether 1 minute or weekly
No. It still applies.
Advanced Use of MACD and MA
In addition to the basic MACD and MA usage, it is far from enough to just learn these. After all, the usage of these technical indicators can be found in the public
According to the data, many major players and dealers will deliberately create "false trends" through this point, making you think it will be too late if you don't buy it now.
This is the trick to trick you into getting on the bus.
How to prevent and identify these "fake trends"?
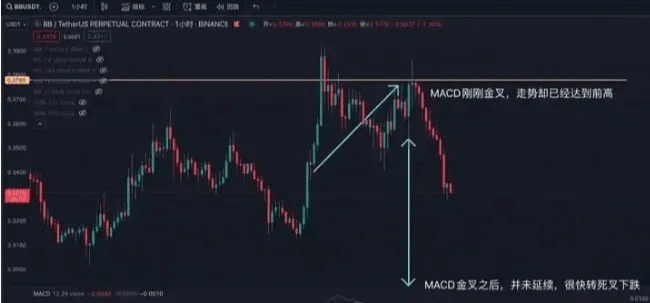
The fake trend is mainly to guide newcomers into the market through the MACD golden cross. Take the 15-minute trend of BB as an example. When the 15-minute trend breaks through the new high,
It turned to fall rapidly, and MACD entered a dead cross, which means that a callback has started. However, during the callback, its trend is recovering rapidly, and even
It is approaching the previous high, but at this time MACD has just started to cross. We can understand this trend as "willing but unable to do what we want", that is, the price has
After rebounding to the previous high, MACD has just formed a golden cross. More than 80% of the results of this trend will be the same as this picture.
It became soft.
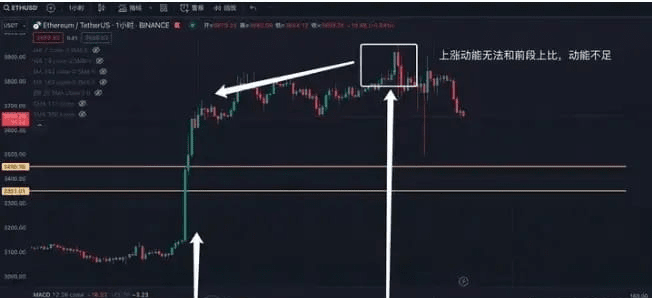
Let's take ETH's 1-hour trend as an example. MACD golden cross, green column rises sharply, and the price follows the rise. This kind of rise is high-quality
If the price rises, it means you can enter the market and follow up. Then the price will enter the sideways adjustment stage and MACD will turn into a dead cross.
Golden cross, but the increase and trend are not continued like the previous golden cross, but are unable to rise, and the MACD volume column is not continuously strengthened
This "hanging and watching" state is very dangerous. Although the MACD golden cross, but the strength is not strong, and this continuous state
The longer it takes, the more dangerous it is. When the price breaks through a new high but the MACD does not reach a new high, we call it a "top divergence".
Strong sell signal. Similarly, when the price breaks a new low but MACD does not reach a new low, we call it "bottom divergence".
Buy signal.
2. Interpretation and application of BOLL+ and RSI indicators
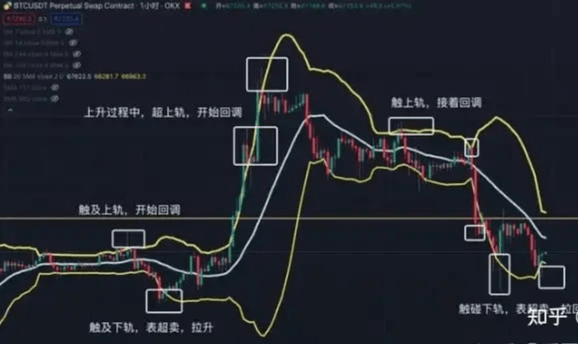
BOLL(Bollinger Bands)
BOLL is a very simple and practical technique designed by John Bollinger, an American stock analyst, based on the standard deviation principle in statistics.
Analytical indicators, I personally think it is very useful in the secondary transactions of blockchain. BOLL is composed of three lines: upper, middle and lower.
The upper rail, middle rail and lower rail. The upper, middle and lower lines of the Bollinger Bands represent pressure and support respectively. When several of them reach the upper rail of the Bollinger Bands,
A callback due to pressure. When the Bollinger Bands are below the upper track, they will be pulled up due to support. When the stock price rises above the upper track of the Bollinger Bands, it means it is overbought and there will be a callback.
On the contrary, when the stock price falls below the Bollinger Bands, it means that it is oversold and the market is extremely weak.
When the stock price falls from the upper Bollinger Band to the middle Bollinger Band, the middle Bollinger Band plays a supporting role. If it falls below the middle Bollinger Band, it becomes a pressure point.
When the lower track rises to the middle track, it also faces pressure. Breaking through the middle track and stabilizing means that the pressure level turns into a support level.
Here are 10 golden rules of Bollinger Bands that are important to know:
1. When the price breaks out of the upper track, beware of a pullback. 2. When the price falls out of the lower track, beware of a pullback. 3. The strong market is always in the middle track.
4. The weak market is always below the middle track 5. The narrowing of the upper and lower tracks hides the sudden change 6. The larger the opening, the greater the market momentum
7. The middle line indicates the trend direction 8. The sudden closing of the channel indicates a reversal 9. The sudden opening of the channel indicates that the consolidation is no longer
10. The longer the channel narrows, the smaller the opening will be, and the more obvious and drastic the changes in the future market will be.
Example explanation:
Let’s take the one-hour trend of BTC as an example. BOLL is mainly divided into three lines: upper track, middle track, and lower track.
When the price falls below the lower track, it means it is overbought and the probability of a pullback is high. When the price falls below the lower track, it means it is oversold and the probability of a pullback is high.
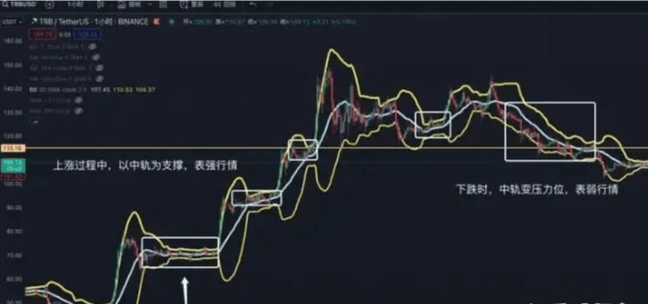
Let's take the TRB 1-hour trend as an example. When the BOLL band narrows, it means that there will be extreme market conditions, but BOLL does not
It is impossible to accurately judge the specific direction, and other indicators are needed to assist in judgment. The longer the narrowing time, the shorter the BOLL band, which means the more turbulent the future market will be.
At the same time, in a strong rising market, BOLL will rise slowly along the middle track, while in a super strong market, BOLL will continue to rise above the upper track.
On the contrary, in a weak market, BOLL will fall along the middle track, and at this time the middle track turns from a support position to a pressure position.
BOLL will continue to fall below the lower track.
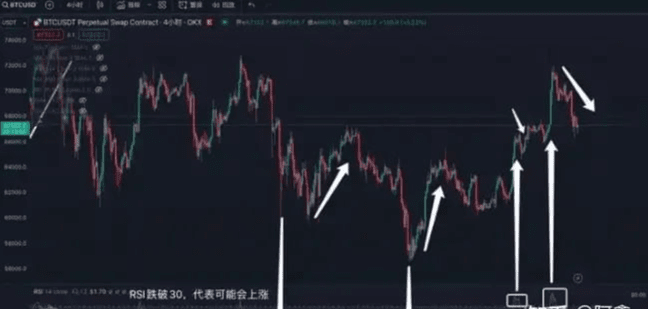
RSI (Relative Strength Index)
RSl (Relative Strength Index), its principle is to infer the strength of market movement trends by calculating the amplitude of stock price fluctuations
The RSI value changes from 0 to 100, which means that the price will not exceed this level.
We can simplify it to say that when the RSI reaches 70, it means the market is overbought and the risk of a correction is increasing. When the RSI falls below 30, it means the market is overbought and the risk of a correction is increasing.
, it means the market is oversold and may rise.
Example explanation:
Let's take BTC's 1-hour trend as an example. When the RSI falls below 30:11, it means that it needs to go sideways and pull back. However, this pullback is not absolute.
It can mean that the market is very weak and cannot be used as a basis for direct buying. Secondly, when the RSI breaks through 70, it means that it is overbought and there may be a pullback.
Risk. However, this still cannot be used as a basis for buying and selling, but can only be used as an auxiliary judgment. Note: In extreme market conditions, RSI can reach 99 or
1. So don’t use RSI as the main basis for judgment.
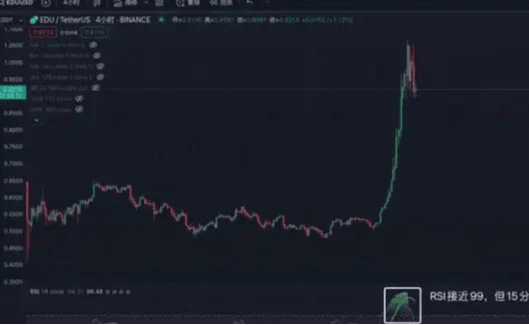
Let's take the 4-hour trend of EDU as an example. After RSI broke through 70, it continued to rise and finally reached 99.
We need to determine the nature of the stock/currency, whether it is a small market value, MEME currency, or a high
Compared with blue chip currencies, the RSI judgment of other small currencies may need to be raised to the range of 90 and 10, rather than 30 and 70.
You need to use your own judgement.
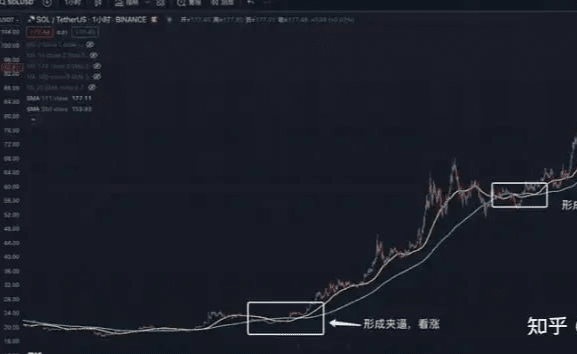
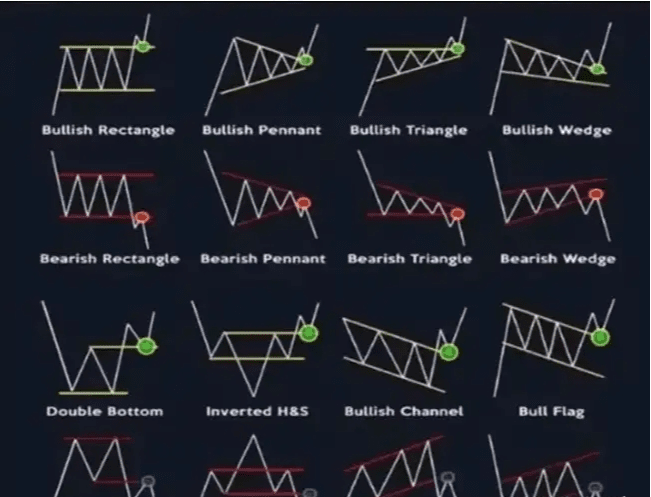
3. Flag-shaped finishing variations
Flag consolidation is also called triangle consolidation. This consolidation is not judged by indicators, but by the trend changes on the K-line. We can summarize it as follows:
16 common basic change types. If you see similar trends, you can buy. Generally, the success rate is very high and the subsequent trend is bullish, but there are also failures.
When the price fails, it is recommended to buy at the low point of the flag. When the price breaks through the triangle area and rises, the breakout area becomes a support position, and the price falls later.
Can intervene near the support
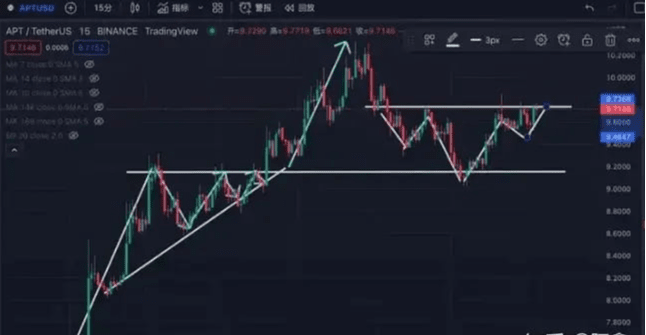
Example explanation:
Let's take the 15-minute trend of APT as an example. Its trend is a standard reproduction of the third and tenth trends in the above figure. However, it should be noted that
This is just a successful case. Many main players and dealers will deliberately make similar graphics to deceive people into buying. We need to be careful to identify them, or promptly
Stop loss.
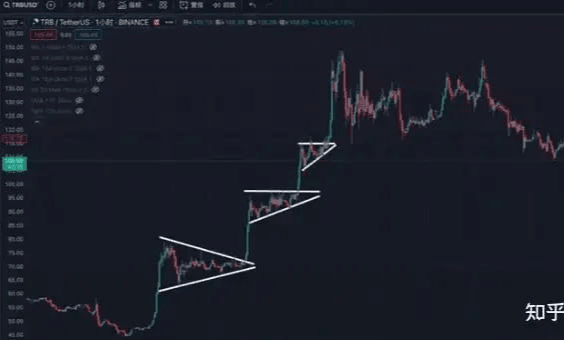
Taking TRB’s 1-hour trend as an example, we can see that TRB has used the trend of the three-week flag consolidation to achieve a three-fold increase in a week.
So when we see a similar trend in the market again, we can figure it out ourselves for verification.
IV. Conclusion
As the saying goes, Tao, method and technique are indispensable in trading. This report only focuses on the "technique" in the trading process.
The use of technical indicators is far from enough. There are many pitfalls in the market, and the market trend and rising pull-ups change every three months or so.
And the methods of falling will be greatly updated, so you need to keep watching to summarize and observe the subtle changes in the market.
People are alive, indicators are dead. The existence of technical indicators is to help us judge transactions after sufficient understanding and risk control.
Methods cannot be used directly to make profits. After all, all technical indicators are lagging and cannot be 100% accurate.
Only after understanding and risk control can you assist in investment, otherwise it is just gambling.
At the same time, all technical indicators are not as simple as described in the report. Each indicator has different deformations and methodologies.
Each indicator can be studied for several years, so the article does not mention all the variations and methods.
The situations in which indicators are used are also different, and they need to be gradually adjusted according to one's own trading style.
Some advice and suggestions for newbies in the cryptocurrency world
1. The road to Shu is as difficult as climbing to the sky. The difficulty of trading is as difficult as going against human nature.
Second, the main difference between investing and trading is that one is prediction and the other is following. I am just a trader, so I didn't run away from the high position.
What to do? Wait for a rebound. There is a high probability that there will be a daily rebound in the next month, which will last for more than half a month.
The bull market is over, clear out your positions and run away, otherwise just keep watching.
3. In the trading market, I would rather be a turtle, ignoring how fast the rabbits run and just doing my best.
4. A piece of news that everyone knows is worth zero
5. As long as you don’t back down, give up, and remain resolute, you will definitely see the moment when you reach the pinnacle.
I am Axin from Circle B, an old player who sincerely wishes you to make a fortune in the cryptocurrency circle.#美国加征关税 $BTC