
Bitcoin and the broader cryptocurrency market showed remarkable resilience on Monday as oil prices fell nearly 6% after hitting a five-month high following U.S. airstrikes against Iran over the weekend and fears of Iran closing the Strait of Hormuz.
The S&P 500 index rose to 6006 points today, up 0.52% from the previous session, hovering above the psychologically important level of 6000 that was breached for the first time earlier this month. The Federal Reserve kept interest rates steady for the fourth consecutive meeting at 4.25%-4.5%, maintaining a wait-and-see approach amid uncertainty regarding the effects of tariffs and tensions in the Middle East.
Gold sits near $3,388 per ounce as investors hedge their bets while the significant drop in oil prices today removes one inflation worry from the Fed's radar and shows that markets are not really seeing a global escalation, at least in the short term.
But these are cryptocurrencies, and while institutions may exercise caution when choosing where to invest, retail traders are eager to buy high-risk, high-reward digital currencies that appear insulated from macroeconomic factors.
Bitcoin and Ethereum: Major currencies heading towards recovery
Bitcoin's price rose by 2.35% over the past 24 hours, trading at $102,044, sharply recovering from the panic seen over the weekend that drove prices to lows near $99,000. This move represents a critical test of the $100,000 level, a significant psychological level that has attracted the attention of market participants, reinforcing its position as a strong support point.

Bitcoin trading data. $BTC
The Relative Strength Index at 58 indicates slight bullish momentum without approaching the overbought area (above 70). This "average" reading suggests that Bitcoin has room to rise without triggering immediate profit-taking. The Relative Strength Index measures whether an asset is overbought (above 70) or oversold (below 30). It can be considered a gauge of market movement. When the Relative Strength Index falls below 30, it often indicates that sellers have exhausted their energy, paving the way for potential recoveries.
Bitcoin is currently trading above its 50-week exponential moving average (around $86,000 according to the chart), but it faces resistance from multiple time frame approaches. Typically, the expanded gap between Bitcoin's average price over the past 500 weeks and its 200-week exponential moving average indicates ongoing buying pressure, which traders generally interpret as bullish for medium-term investors.
The key levels for Bitcoin are very close due to its sideways trading for some time:
Immediate support: $100,000 (psychological level and options concentration)
Strong support: $86,000 (50-week exponential moving average area)
Immediate resistance: $107,000 (recent rejection point)
Strong resistance: $110,000 (approaching the all-time high area)
The weekly chart for Ethereum indicates positive performance, with the second-largest cryptocurrency trading at $2,285 after a significant price surge in April. The technical situation suggests accumulation in prices below the resistance level.

Ethereum trading data. $ETH
The Relative Strength Index (RSI) is at 47 in a neutral zone, indicating no overbought or oversold conditions. This average reading often precedes directional moves, showing that the market has absorbed recent gains without excessive selling pressure. Traders view an RSI below 50 during bullish trends as potential buying opportunities.
Most importantly, the ADX at 22 is still below the trend confirmation level of 25, indicating that Ethereum is in a consolidation phase rather than trending. This low ADX reading after a strong movement usually indicates accumulation before the next rise, especially when prices stabilize above key moving averages.
Both the 50-day exponential moving average (EMA) ($2,480) and the 200-day exponential moving average (EMA) ($2,093) characterize the current price movement. The current price movement is trading around $2,245, which is significantly lower than the EMA range of 20/50 between $2,480 and $2,525. Ethereum's precise rebound from the 200-day exponential moving average indicates that this long-term moving average has served as an attraction for buyers. It should be noted that institutional algorithms often target these levels.
Key levels:
Immediate support: $2200 (50-week exponential moving average)
Strong support: $1800 (200-week exponential moving average)
Immediate resistance: $2600 (recent rejection area)
Strong resistance: $3000 (psychological level)
SPX6900 Index: Increasing meme momentum
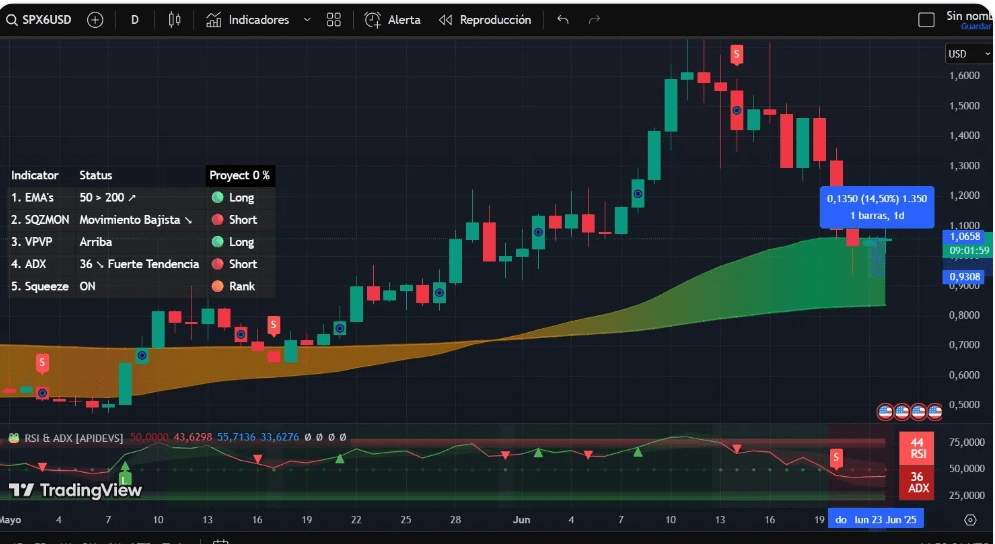
SPX6900 index trading data.
The 24-hour chart of SPX6900 meme coin saw a sharp double-digit rise to $1.35 before correcting to its current price of $1.35. This is enough for a 14.5% increase since yesterday's drop, showcasing the strength of meme coin momentum when conditions align.
The Relative Strength Index at 44 may seem bearish at first glance, but context is the critical factor. After a violent sell-off, this recovery from an oversold condition (below 30) represents a shift in momentum. In other words, while people are selling a lot, it is not to the same extent as it was a few days ago, indicating a decrease in the number of sellers and a potential start of recovery.
However, the Average Directional Index (ADX) at 36 indicates a strong trending environment. Readings above 25 confirm trend strength, while readings above 35 indicate strong directional movement. This is common in volatile meme coins that move sharply in both directions. The downtrend is still in place, but the decline in the ADX compared to previous days may indicate exhaustion among short sellers.
Price behavior shows that short sellers managed to push prices below the 50 exponential moving average (the average of the past fifty days), but the momentum lasted only a few days, and the price is recovering. Successful defense of levels below $1.00 prevented a deeper correction, attracting new buying interest and dismissing a potential death cross scenario in the near future. So, you can take a breather now - whatever that means for meme coin traders.
Key levels:
Immediate support: $1.10 (breakout retest level)
Strong support: $0.93 (recent retracement area)
Immediate resistance: $1.50 (round number resistance)
Strong resistance: $1.77 (all-time high)
Vart Coin: Technical rebound meets whale interest

Vart Coin trading data.
Despite its correction, Vart Coin shows remarkable strength with a 13% rise from its low yesterday to $1.10, driven by a range of technical factors and trading dynamics on the network, suggesting further upward movement in the future.
The Relative Strength Index (RSI) at 38 shows a sharp recovery from an oversold condition. This is still in a downward zone, but it shows an improvement in momentum from its lowest points without reaching a neutral level (50). This could serve as an "ideal point" where the risk/reward ratio favors long positions - selling has been exhausted while buying interest has returned. For added richness, the coin has not dropped below its average price over the last 200 days.
The Average Directional Index (ADX) is at 19, below the trend threshold of 25. This low reading after a sharp decline often indicates accumulation areas where smart money focuses before the next directional movement. Along with the price rebound, this suggests a potential trend reversal, but it has not yet been confirmed.
The successful rebound from the $0.90 support level shows a willingness to buy at key technical levels known as "Fibonacci levels." Essentially, these are natural price areas formed between the lowest and highest points in price movement. In other words, short sellers are struggling to push prices below that area.
Key levels:
Immediate support: $0.95 (psychological level)
Strong support: $0.90 (Fibonacci 78.6% / established retracement zone)
Immediate resistance: $1.10 (EMA50)
Strong resistance: $1.3-$1.4 (major resistance zone)
Disclaimer
The views and opinions expressed by the author are for informational purposes only and do not constitute financial, investment, or other advice.