🟠 #Bitcoin: Decline in open interest and price
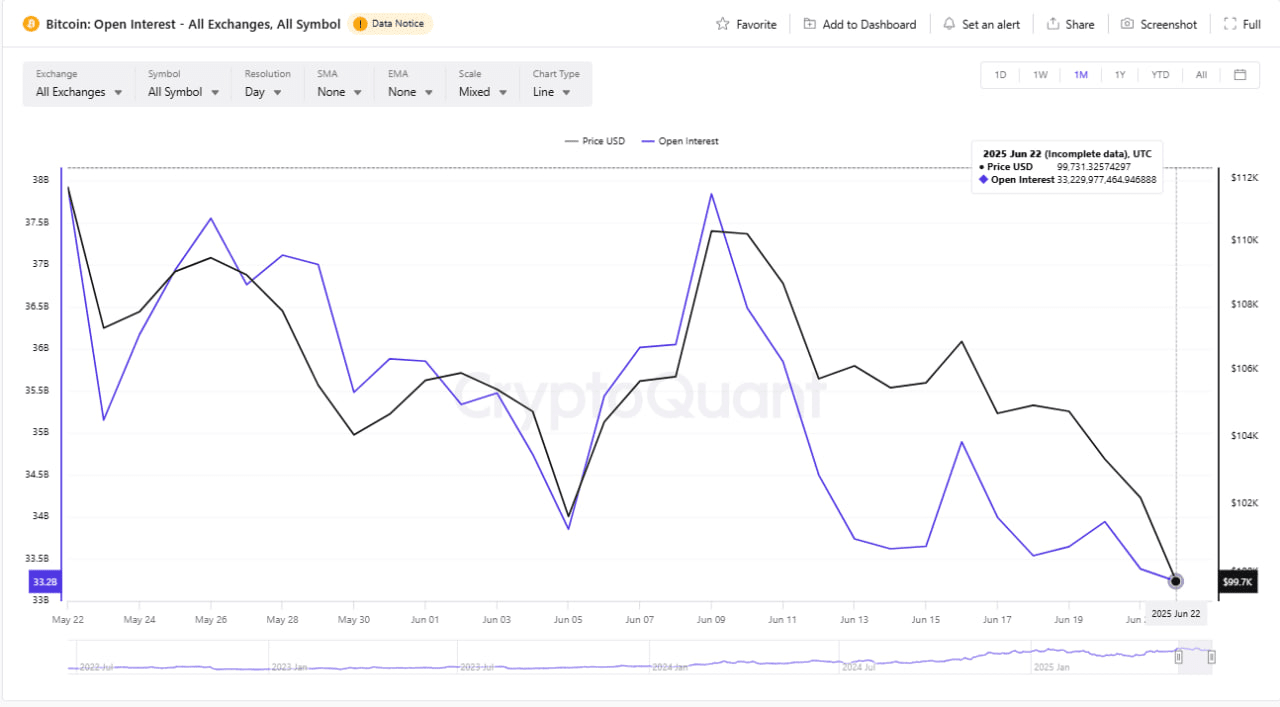
📈 BTC Price: $99,731
📉 Open interest: 33,229,977,464 (significant decrease)
🔍 What is visible on the chart:
At the beginning of June, there was a sharp spike in price and open interest, peaking around June 9.
This was followed by a gradual and steady decline in both metrics.
As of June 22 — the price fell below $100K, and open interest reached one of the lowest values for the month.
📌 Conclusion:
👉 Decrease in open interest indicates a decline in trader activity, which may mean:
profit-taking,
decreased confidence in short-term growth,
possible consolidation before a new move.
🔵 #Ethereum: Similar dynamics to BTC
📈 ETH Price: $2,194
📉 Open interest: 15,846,650,283 (also decreasing)
🔍 What is visible on the chart:
Similar to BTC, there was a rise until June 9, followed by a crash.
Price and open interest move in sync, reaching minimum values at the time of analysis.
ETH, like BTC, is declining in the context of falling interest from market participants.
📌 Conclusion:
👉 The decrease in open interest and price signals a transition of the market into a phase of uncertainty. It is quite possible:
waiting for news,
a breather before a new wave (up or down),
exit of large players from positions.
📉 Total result:
📌 Both charts (#BTC and #ETH ) demonstrate a high correlation between price and open interest.
📉 Sharp decline in open interest — a concerning signal.
🔍 This may indicate a reduction in speculative activity and a likely sideways movement or continuation of the correction.
🔔 Recommendation:
📉 While the market is in a down phase — it is reasonable:
exercise caution with leverage positions,
consider a 'picking' strategy at support levels,
monitor spikes in open interest — they may signal a reversal.