1. Summary of Yesterday's Market
Yesterday, SOL faced continuous pressure, falling below the key support level of 148 in the afternoon and crashing to 135.57 during the evening session, with an intraday fluctuation of over 9%, marking the largest single-day drop in recent times. Although there was a slight rebound towards the end, the overall close was still bearish. Current market sentiment is tending towards panic, but there are also signs of stabilization, indicating a short-term technical rebound demand.
2. Analysis of Major Events from Last Night
The US has released economic data slightly above expectations, US Treasury yields have surged, and risk assets are under short-term pressure.
There have been multiple large USDT inflows, suspected to be the main force preparing to scoop up purchases, with slight fund inflows on the SOL chain.
After the major and secondary coins broke down, they quickly stabilized. The overall crypto market shows signs of a 'technical bottom fishing', with oversold assets (like SOL) becoming potential leaders in rebounds.
3. Today's Technical Analysis
🔹 Daily Chart Analysis
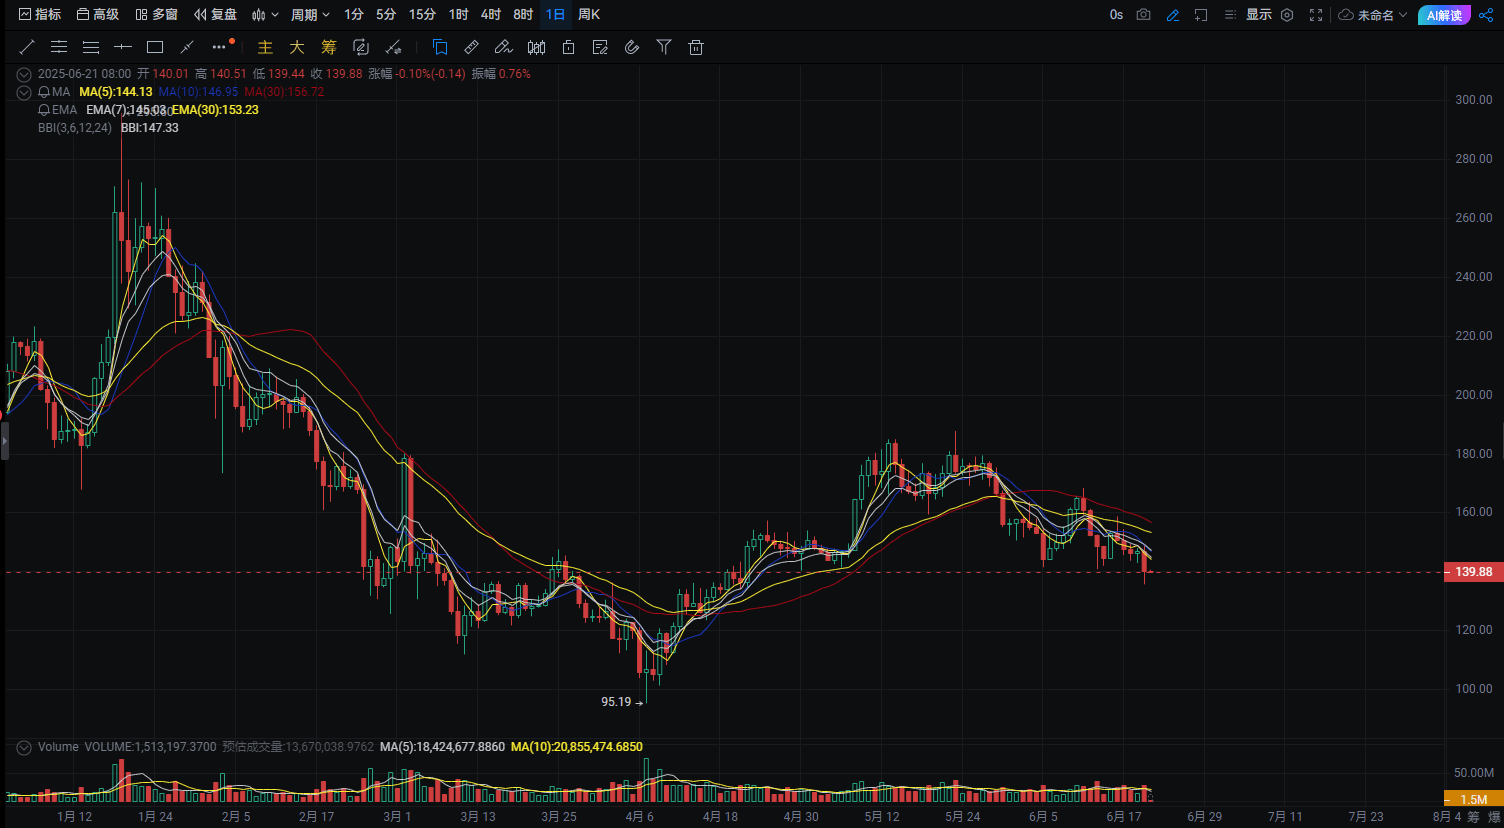
The price quickly rebounded after touching the low support at 135, forming a 'hammer' pattern on the short-term bottom K-line, indicating potential rebound momentum technically.
MACD bearish momentum is slowing, green bar momentum is decreasing, RSI has briefly fallen into the oversold zone, indicating strong rebound demand.
The daily trend remains bearish, but the technical rebound window has opened. Pay attention to the upper MA5 (144.20) and EMA7 resistance levels.
🔹 4-Hour Chart Analysis

After a sharp drop last night, the volume expanded, showing a clear bottom-fishing rebound, a typical short-term oversold rebound model.
The deviation of the moving average is too large, and the price has a demand to return to the short-term moving average (EMA7=142.20).
If the price confirms it does not break lower at 139, it is highly likely to challenge the 142-144 area again.
🔹 1-Hour Chart Analysis

Signs of short-term bottom elevation have begun to appear, currently forming a small double bottom prototype, with the neckline around 142.
Volume increases with the rebound, indicating active momentum release.
If the volume breaks the neckline, it will trigger a rapid pullback.
4. Real-Time Long Strategy Recommendations (100x Leverage Basis)
Current Price: 139.92
Operation Price Point Description
Entry Position 139.50-140.30
First Take Profit Position 141.40
Second Take Profit Position 142.70
Stop Loss Position 137.85
Core Logic of the Strategy:
Yesterday's drop was significant, indicating a technical rebound window in the short term;
The current structure belongs to 'short covering + left-side trading', suitable for trying light positions;
If 142 is confirmed to break, it will open up greater rebound space to the 145-148 range.
Risk Control Recommendations:
This strategy focuses on 'buying the dip for a rebound', not a trend reversal. Always use stop losses to avoid profits being eroded by pullbacks. Strictly control positions and add to them only after confirming that the price does not break lower on a retest.
Want to seize more precise opportunities like this? Follow Yang Ge, avoid emotional trades, and do not step on regulatory landmines. Accurately predict the next wave! Strategies are continuously updated, please pay attention to the 'In-Circle Think Tank' channel to avoid unnecessary 'silent platform' disturbances. #加密市场回调 #SUI #SOL #PEPE #ETH $BTC $ETH $SOL


