

01:37
Long or short?
01:46
This kind of logic. Can we understand it this way? How? Then you say, the closer you get to this resistance, do you go long or short? The closer you get to this resistance, do you go long or short? If it breaks up, what does it represent? The market framework has changed from bearish to bullish. Otherwise, at this point, you should have closed your long position if you had one; if you don’t have a long, you go short. One sentence: long or short? This sentence should be concise enough.

02:26
You didn’t break through, so what’s wrong with shorting? If it breaks through, do you have a stop loss? Or do you wait for it to consolidate in one place a bit more, block him on the left side, and then break through on the right side? Otherwise, how to look at it in this place? I released a video last night; I think that video is very concise and very important.
02:55
For example, when the market is dropping, you always ask me where to go long, where to go long. This kind of thinking is left-side trading; left-side trading comes with counter-trend trading. You will never ask if this place is a breakout, can I chase the short? You always ask, this place keeps falling, where do I go long, where do I add positions, where do I go long, where do I go long? That’s your thinking, so left-side trading is very normal with leverage.

03:48
Do you understand? Do you understand what I’m saying?
04:28
First, if you bought at 4, you must be very optimistic about this SUI, right? When you bought at 4, you must be very optimistic, right? Since you are optimistic, shouldn’t you be happy when it drops to 2.8? I can buy at a lower price. Shouldn’t you be happy? Also, when do you say you can buy? Sometimes you draw a trend line yourself, right? Just a breakout of this trend line, then you can start to buy slowly and increase your position. In summary, it currently has not created a higher high, so the market framework has not changed. I don’t know if you can understand this sentence.

05:05
So what exactly do you want to short or go long? How do you see it? If I go long, my strategy is to wait to buy on the left side at levels like 0.886 or 0.618 where there are higher lows. But if the right side hasn't broken out, how can I go long on the right side? If it hasn't broken out, how can I go long on the right side?

06:34
So let’s take a look at Ethereum. What’s the logic of Ethereum? Is there anything you don’t understand? You go look; is it like I’m hitting you? Can you understand that? If you can’t understand, I’m a newbie, I won’t, but I just want to make money.
07:21
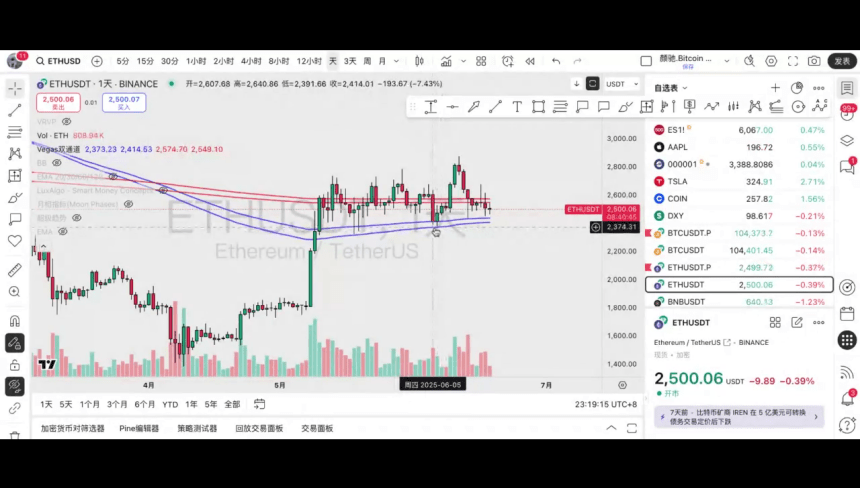
This should not be difficult to understand. You say originally this 2550 or 2540, what was it originally? It was originally support, right? After breaking down, support turns into resistance; when the resistance hasn’t gone up, you can’t look at the bullish side. Where is this multi-bottom? Usually, the best thing is that many traders think this place is a multi-bottom, which can’t break through. The best trading opportunity is to wait for it to break down and then come back up to go long; this is the best trading logic.

08:10
So take a look at this chart, save it, and then just roughly set it for about 30 minutes or an hour. Open the market and set it up yourself. Just draw the chart a little, like what this place is? Originally, you see this place, it was originally 0.666 of this segment, you see. I was like this before. 0.618 and 0.666 is a range, and if it breaks below, the original support becomes the current resistance.

09:04
Isn’t that difficult to understand? Not difficult. So currently, if you want to go long, you should look for multiple bottoms. Multiple bottoms wait for it to break down and come up; just decisively go long. As for whether you can see how high, I don’t know. You know the resistance is at 2544; the first target is to look at 2544. What position is there to go long? You look at 2800; you made a long, you look at 3000.
09:43
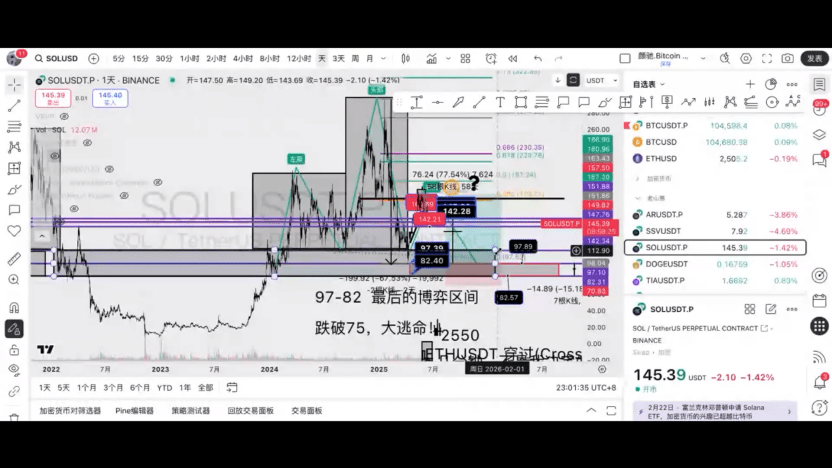
Then, this trend line is a long-term trend line; it started from here, a trend line breaking from May 10 to go up. This is a liquidity grab, very good for diving. I also released this video yesterday, left-side trading, counter-trend trading, and there’s nothing much to say about altcoins; the blood flow is like a river. Look at SOL; you see these few lines, right? This is 142. So the closer you get to 142, you can say left-side orders go long. And don’t forget, it is currently in a downtrend; on the left side, you should reduce your position until it turns from left-side to right-side. What does it mean to turn from left-side to right-side? For example, it means after this consolidation, if you see resistance that can’t go up and then drops down, after breaking through, then you can increase your position. Otherwise, it’s just left-side heavy positions; I don’t know what you’re thinking.

11:17
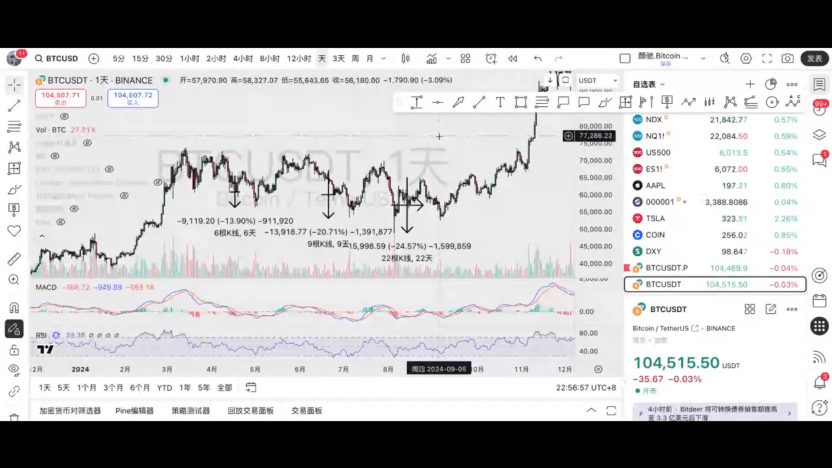
Then, I mentioned many times that this daily-level MACD is also very critical. If the daily-level MACD fast and slow lines are below the zero axis, then there’s no play. If the daily-level fast and slow lines cross the zero axis, then the market is unplayable. This is not to scare anyone; it means if the fast and slow lines are below the zero axis, usually I will clear many of my holdings.
11:44
I previously gave everyone an example; for example, this place, the fast line is below the zero axis, right? Even though it has taken 16 days to drop after that. As long as the fast and slow lines are below the zero axis, there’s no expectation of a bull market. For example, in this place, fast and slow lines are below the zero axis. So the fast and slow lines below the zero axis mean it’s in the control of the bears currently.
12:22
What does left-side heavy mean? I never let anyone go heavy on the left side. Will it be a rate hike tonight? No idea; you’ll know when it’s announced at two o’clock. Why guess this?
12:54
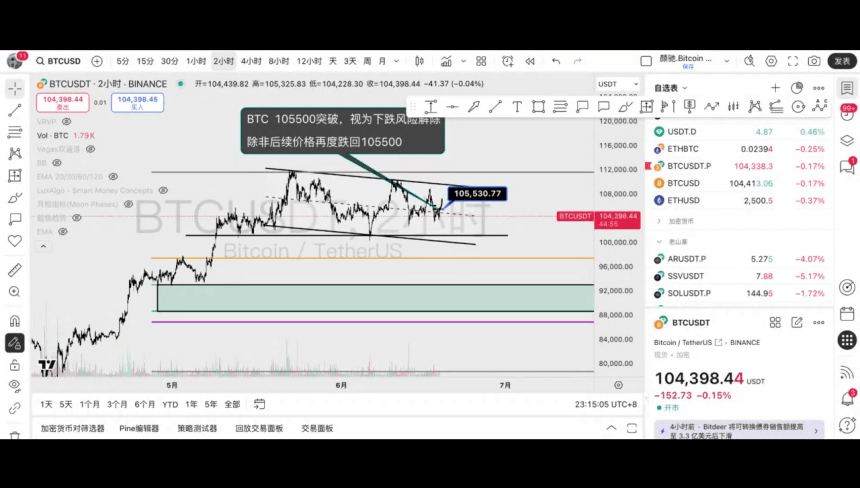
Then make it clear in writing, and you will understand. BTC breaking 105500 is why it is regarded as a bearish risk being lifted.
13:42
Unless the price drops back to 105500 again. When you see it, no matter whether you say you are going long or short, right? If you go long, then when it breaks 105500 points, you can follow the trend and dare to add positions. If you dare not add positions, just hold your base position and continue to make money. If you want to short, then go short as you get closer to 105500 points. Just look at whether to set a stop loss of 800 points or 1000 points; that’s fine. What else is there to look at in trading? Nothing. How do you see it? Let me check it out for you; it’s just like this.

14:24
After interest rate hikes, does it rise or fall? If you don’t know what a rate hike is for, you don’t know what impact it has on the market. So when I tell you if it rises or falls, you also won’t understand. Rate hikes mean liquidity is drained; doesn’t a lack of liquidity lead to a drop? How could a rate hike lead to a rise? Right? You don’t understand the impact of rate hikes and cuts on the market. So when you ask if the latter raises the rates, whether it’s up or down, you won’t understand.
15:03
Is TIA still salvageable? If you ask me, I will definitely say yes, right? I will definitely say yes.
16:02
It’s not just TIA’s despair; many altcoins are in despair. It’s not just TIA that’s dropping; all altcoins are dropping. Did you say Dogecoin dropped? It also dropped. What about other coins? Did the previously popular PEPE drop? It also dropped. Right? Did WIF drop? It also dropped. It’s not just the issue of a certain altcoin; it’s that all altcoins are dropping. All altcoins are dropping. AR also dropped a lot, and SSV also dropped a lot.
16:36
Actually, I previously thought the direction I gave for SOL is classic. Just make a left shoulder, head, right shoulder, and the right shoulder just reaches 180. So if SOL indeed hangs high and falls later, it will feel great. TIA is not just about this coin; the whole market has no liquidity, and all altcoins are dropping.
17:23
You say OP was once such a cool coin, but it also dropped a lot. It’s not just a matter of a single altcoin; what do you reflect on? Look back at this SOLV; they are really cool. This one has been horizontal for a long time, and in the case where the market has not continuously broken through, it just goes up and down like this.
17:59
Also, for coins like SUI, some coins can drop and can rise. When it rises, you don’t sell, and when it drops, you can’t accept it. So why buy?

18:47
I am a newbie; I don’t know. But I marked the Arabic numerals for you; can’t you see the Arabic numerals? I won’t tell you to do something if 2554 doesn’t break. If you can’t even distinguish resistance and support, then you can’t differentiate between left and right.
19:17
Also, what is this? How does the risk-reward ratio come about? For example, if you go back for a 15-minute market segment, what can you do? Grab the higher highs and lower lows yourself. For example, 618, 886 is the best gambling, right? If you create a new low, I’ll just stop loss, losing a few points. For example, I’m near 886, and it breaks a new low at nine knives; you don’t dare to gamble, right? Let it drop a bit, losing fifteen, eighteen, twenty knives. 886 is always the best number to use; the risk-reward ratio is very high.
19:51
Going long at 2480, where to take profit? Now let me ask you, where did it start to decline? I have marked it on this screen. This was the previous support, and now it is the resistance. How many times has it failed to break today? From yesterday until now, there have been 1, 2, 3, 4, 5, 6, 7 times it hasn't broken. So where do you think you should take profit?

20:41
This is fine. Where to take profit? It’s where it has fallen and can't rise again; you go to that place to take phased profits. If you made a long, you should look for three thousand, you should look for 4800, right?
20:57
You want to indulge; don’t ask anyone, okay? Subjectively indulge at will, objectively look at the market. Just like I say, what does subjective indulgence mean? Even when I’m eating, if the server or someone beside me calls “handsome,” I will indulge in thinking they’re calling me. Subjectively, I would turn around.
21:17
So what is the objective fact? People call others; this is subjectivity versus objectivity, right? When you are eating, if someone beside you calls you “handsome” while you eat late-night snacks, will you turn around? You will turn around, so you subjectively think they are calling you. If you turn around and look objectively, it’s not, so how you want to indulge is up to you. Just observe the market objectively.
21:53
How to look at SOL? SOL is just those three lines; how can I see it? It’s just those three lines. So how did these three lines come about? You cut a four-hour or daily chart and draw those three lines’ prices, and then look from the left side. For example, you see 1511, 47, 142. That also means before 142 doesn’t break, can’t you say you can go long at 142? If it breaks by 2%, 3%, 5%, give it to him. Right now, no matter how you look at it, either you look at the pullback that can’t go up to 147, then short down, it’s currently floating in mid-air at 145. So this kind of situation is not worth gambling; either gamble as you get closer to 142, or gamble as you get closer to 148.

22:54
You say, at the current price, should I go long or short? The resistance is very far, and the support is also very far. So doing this is a very poor risk-reward ratio. Where should I place my stop loss? Where should I set my take profit? Neither long nor short, so let the market play out. When it comes to this point, are you going to short on the left side or go long on the right side? I can’t tell you in advance; if it breaks out with high volume, I still tell you this is a short. If I tell you four hours in advance, I’ll let you short here, and four hours in advance, I’ll let you lock in this stop loss. Understand? Left side is always light positions; you can’t understand what left side light positions mean. You’ll think people are just showing percentages and making a lot of money from one order.
23:55
Also, look for some trends yourself, like higher lows and higher highs rising. What trend is this? A bullish trend, right? When higher lows and higher highs lower, what trend is that? A bearish trend.
24:09
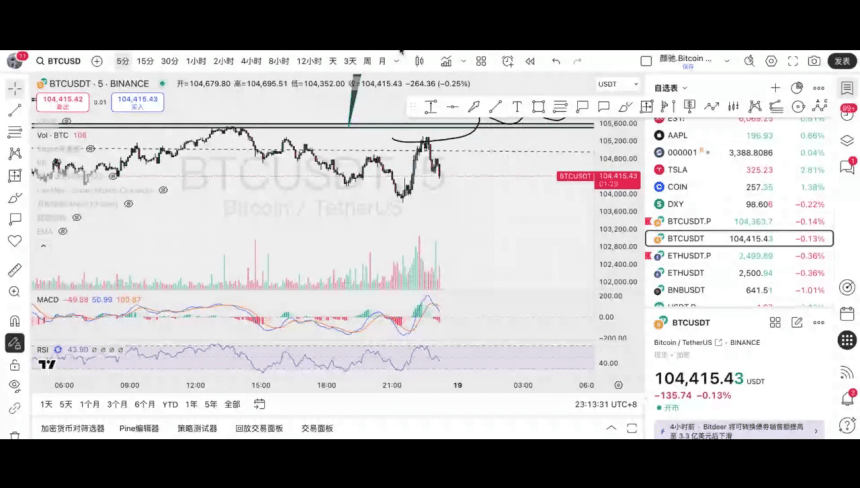
So what altcoins to watch, or what SOL to look at is useless. You should honestly focus on Bitcoin and Ethereum. For instance, look at Bitcoin; what is it doing in the 15-minute chart? Although this segment of the market shows lower highs and lower lows, from this point, the lower highs and lower lows are forming a small bullish trend. As long as it doesn't create a lower low, shouldn't I be looking to go long first to target higher highs? It's not difficult to understand; just observe whether it is getting closer to support or resistance, and then you can make your play.
24:50
For example, if you are bearish, right? You believe that 105500 hasn’t broken, so you want to short. Then the closer you get to 105500, you should short. Because higher highs and lower highs, if lower lows appear, you know where your fish head is. So many times when you ask, you can’t distinguish whether you want to go long or short, and you don’t know what level you want to trade. So how do I explain it to you? And some of you say, is it long or short now?

26:12
105500, here you can short or long, it just depends on whether you are bullish or bearish.
27:03
The general direction is still bearish; even on the daily chart, you can’t wait. Look at the weekly MACD; let’s see where the dead cross is, where is it dead?

27:43
I don’t understand; where did it die? How did it cross? Where did you hear that the MACD on the weekly level for Bitcoin crossed down and you said it crossed down? It hasn’t. Looking from the market, hasn’t it not crossed down yet? What can you say? You can say this segment of the market created higher highs, right? The MACD created lower lows, and at this point, you should indulge in thinking that the weekly MACD is a top divergence. But did it cross down? No, not yet. This kind of thing we can often see from previous tops.
28:27
You see it creates higher highs, and the MACD creates lower lows, but. Looking at cryptocurrencies, I usually look at the weekly chart for a long time. I tell everyone I’ll look at the daily chart, and that’s enough. You look at the weekly chart, and then you fixate on this five-minute chart for trading. It’s meaningless.
29:25
Currently, I basically don’t use indicators. If you want to use indicators, I only recommend using the Vegas channel, right? Simple and easy to use. You’ve known me for so long; when did I ever use indicators? I never used indicators; I draw charts myself, just randomly draw support and resistance; just draw it out yourself. Then just wait for the four-hour position to gamble; it hasn’t arrived, right? Play games, read books, find good ways to pass the time. There’s no reason to buy anything without trading opportunities; you must go long and short.
30:23
What EMA does Vegas use? You know about Vegas, so search for Vegas channels on Baidu; it will explain in great detail. Search on Douyin, and it will explain it even more clearly. If you ask me, the second article pinned on my homepage contains teaching content. If you ask me here, and I tell you to wait, you will forget again. You need to have a stronger exploratory ability. If you don’t even search for it yourself, and I just list it for you, and then you ask me where to set it up and how to use it, it’s better to understand it yourself.
31:22
So the logic of Bitcoin is like this; take a screenshot. There’s nothing to explain. If it goes lower, it may go somewhere like here; you see low liquidity points, low liquidity points, low liquidity points. 103900, 103400, 102700. That’s it. Look step by step; push slowly again. Don’t just short on one order; look at where to go short; look at where to go long. For example, currently, it’s in this channel, a descending channel; is it also possible for it to drop to this place, channel 99800, go up shortly, or it might just not break or drop.

32:39
I’m telling you, even if they raise interest rates or launch missiles, so what? Will you get rich because of this trade you made? Will you? Will you get rich because of today’s trade? Then since you won’t, just look at tonight’s game; there are two cheaters sitting there, and you have to sit down to play, lose money, and then complain. Everyone is scamming; you’re not stupid. Who is stupid? So how to see it at two o’clock? Trump, what Powell, today Iran is going to launch a missile. Two time nodes are placed here, and you have to take that uncertainty.
33:39
There’s no need; you don’t care how it crashed today or how it surged; just do it tomorrow. Since we don’t know if it will cut rates or not, right? What we know is that the resistance is here, and the support is here. We have already formulated a trading strategy, which is to break below 2460 and be able to close above; we will go long again. This trading strategy has already been established. In addition, for example, we look at this place; we close our drawing, and then for example, this Vegas channel, we look at it.
34:13 Daily level 144169 so close; what reason is there not to gamble? What reason is there not to gamble? 2435, 2408, what reason is there not to gamble? When you are doing well at 2700, 2600, and reach this daily level, you see it tested once, twice, three times, four times, five times without breaking through the daily level of support, are you still worried about a missile that might break this support? Go study politics, don’t study trading.
34:52
This position is like the position of 2800 last year. At the position of 2800, when it dropped, it was sprayed for a long time, really for a long time. But at that time, it was also very uncomfortable; you say if it doesn’t break, will you buy? Right? You clearly want to buy, you just saw me buy there. The next day, it drops down, and you come to scold me. If I hadn’t seen you, I wouldn’t have increased my position.
35:44
So you go back to the current market, and you ask if this place can be bought, right? Do you dare to gamble? Dare to gamble means going up. If you don't dare, then what’s strange about it? That's it.

36:09
Is it long or short now? Just say that first, and then that. Do you understand? If you don’t understand, I also don’t understand why you ask me if it’s long or short. I am a newbie; I don’t know this sentence.
37:00
Also, today I was talking with Guozi and them, for example, I’m very familiar with this. Let’s assume tonight, if this missile in Iran is pressed by me, he is my buddy; since I have the ability to press this missile, wouldn’t I reveal this news to some people around me? I will press the missile, and you guys in the financial market with money should withdraw or short. If I press the missile, will such a thing happen? If so, you can see from the market that funds are leaving. And there’s news.
38:00
K-lines are not 100%, but we can judge through its trends where to gamble. It’s not just foolishly thinking, oh, here I should go long, and there I should go short, right? For example, that day here to short; I clearly told everyone during the last live broadcast. Why? Because I said at this location between 2640 to 2670, 2680, this place should short, and it was very clear. At that time indeed, many people didn’t believe me; you’re so stupid to say to short when it’s rising so fiercely. Then it drops, and when you ask me what to do now, I also don’t know.
38:36
Just like you see now, it’s reached the lower boundary of this price channel, right? It’s at the lower boundary of this price channel, and it’s also at this daily level. In the Vegas channel support. So how must you gamble? Right? If it breaks, you have to acknowledge it. Because it hasn’t broken the support before, how can I bet that this support will definitely break? If it breaks, the market tells you this is an objective fact. Currently, you bet it will break; this is called subjective indulgence. If it hasn’t broken, you judge it will break; this is subjective indulgence.

39:17
Of course, you can see, for example, you will see some bloggers or traders who indeed did short early, and then shorted to this place, and it also broke. At this time, you will become a fence-sitter. How, right? As long as you wait to gamble at these key positions, at other times, just play.

39:53
The market footprint uses this coin glass, which is not very useful. I use coin glass; I basically only look at these few indicators: one is net bullish, one is entering bearish, then a weighted fee, and then a long-short holder ratio. I just use these; it’s not that other things are not useful; I just find these few are more helpful for me. For example, currently, the net bearish positions you see during this segment of the market are dropping; they are net bearish and continue to hold positions. Then at this point, isn’t the net bearish position leaving, and what appears? It appears that the shorts are covering. At this point, I used to have a misconception; I thought it was just a stop and funds coming in. Actually, this place can be said to be experts closing bulls or institutions closing bulls; you can say whoever is closing bulls. This is a performance of a short covering, and this place is called a natural rebound. Then we look at it; currently, the net short positions are still there, but the net bullish performance is slightly better, showing some signs of entering positions.

41:26
Also, just look at this weighted fee. When Bitcoin keeps dropping and this fee turns negative, it’s a phase bottom; a phase bottom might come. But if Bitcoin is rising and this fee turns negative, what does it mean? It means that this segment of the market is actually being driven by those shorting. The market footprints actually have some better software; that kind of software has a high annual fee. It hasn’t reached that point yet; I feel that currently, in trading, drawing lines yourself is sufficient.
42:23
Gold also meets expectations very well. Gold. Gold also meets expectations very well. The previous view was like this: I said a long time ago that this place is a buying climax. In the past, no one would necessarily trade this gold, right? I also told everyone, if you want to buy gold, just use PAXG, it has contracts and spot. If you want to buy gold, you should buy it here. So in my daily videos, I always interpret this gold.
42:54
Gold is this place before; on May 12, I subjectively judged that the subsequent breakout would lead to a buying climax. I would short at 3527, going short after breaking 3527. But actually, this is a spot trade. Looking from the contract perspective, it seems there was no buying climax at this place; there was no buying climax, but it doesn't matter. After it fell down, the price was still around 3470 that day. I said after breaking the neck line, it would approach this trend line, which is also about the same; it has been gradually approaching. At least currently, this bullish trend line for gold has not been broken, so it’s still being watched upwards. The battle is not over yet.

43:50
Yes, the contract hasn't crossed; I checked later, and indeed the contract hasn't crossed.
44:05
PEPE, yesterday I suggested you click my avatar and watch the video on my homepage. Click the video and check out my latest video; you will understand what I’m saying in the future.

44:28
For example, I often set this alarm; I often set such an alarm, like yesterday’s alarm was at this place. 980, right? I set a long after it broke 980 and pulled back, then a stop loss of 5%, right? Is there a stop loss of 5%? No.
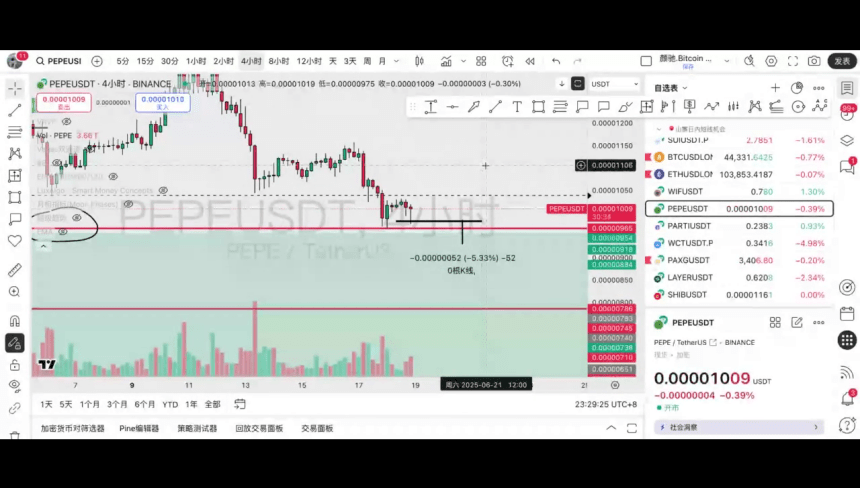
At this time, many people will come to ask, do I look at five minutes, or look at 15 minutes, or look at 30 minutes, or look at one hour, four hours, or look at the hotline? As long as a K-line closes above, you just open it and that’s it; stop loss doesn’t change. Many don’t drop below the close. Right? If it drops straight down, where’s your trading opportunity? Right? If it goes straight through like this, where’s your trading opportunity? You say I stop loss on this order, but it didn’t even give you too many opportunities; you say this order made you stop loss; it didn’t even give you the opportunity to go long.
45:48
This analogy: if you want to go down from the rooftop to the fifth floor, I’m on the fifth floor, and you say, when I see your foot, I pull your foot, I say okay, but you jump down directly and die. How can I grab your foot? That’s the market; you must break below and recover; that’s our condition to go long. You jump down directly and die; how can I go long? There is no trading opportunity.

46:34
Should we stop loss? Let me check. So previously, I think it was at 2.9 or somewhere to lay out a long. I said at that time not to consider stop loss because I was waiting to add long on the right side, but the right side didn’t go up; it should have been mentioned in the last live broadcast. This place at 3.19 breaks; go long on the right side. Let’s find out and be more detailed.

47:15
As long as the first profit trigger is hit, it’s all cost defense. If it drops again later, no one will care about you. Don’t fantasize about just eating a strategy; can you eat enough at 2.92? Going long, don’t consider stop loss, right? I don't know if the person asking me this has been looking at this strategy. 2.9233 long position entered. Actually, I said it very clearly; this is what I didn’t write. It's about breaking below and recovering; I’m letting you go long directly, and temporarily not considering stop loss. Just hold on. The head position is a relatively light position, not a heavy position.
48:05
Here, it was received, and actually, its rebound of 2.92 is a maximum of 8%, and didn’t notify everyone to take profit. Because I think that altcoins rising by 5%, 8% is nothing to show off. And then you see how much it currently dropped; you are looking at 5%; when it previously rose by 8%, you didn’t do it, so now it dropped by 5%, I also think it’s unnecessary. Also, this place is a head position; it’s a head position.

51:03
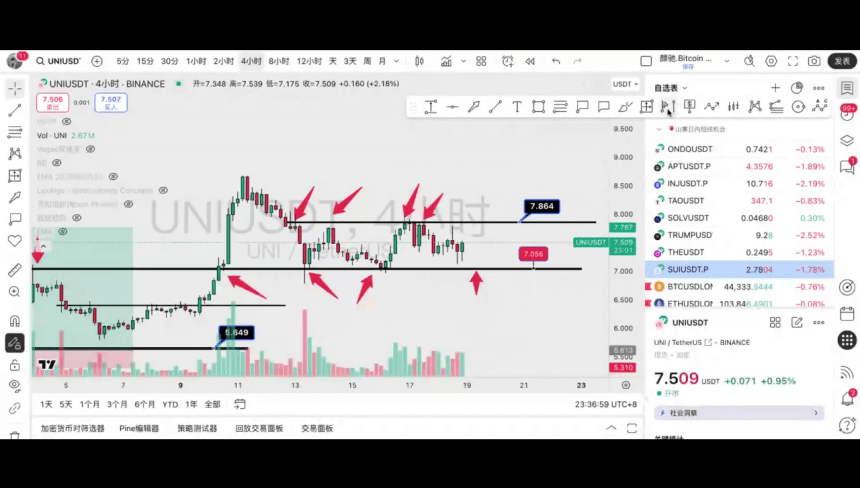
So what about UNI? Let me ask you, what is this place called?
51:26
Then mark this place, which is around seven knives. So the closer you get to seven knives, you just go long, and if it breaks seven knives, just stop loss. How you see it, you don’t need to care; you first need to get in and then see if it can rise. Otherwise, what you should consider now is only stop loss; will it hit your stop loss, not whether you consider taking profit. You currently need to consider if you can see the position; secondly, will it hit your stop loss? These two points should be considered first, and then consider the follow-up take profit, which is this place.
52:01
So why is it this particular place? Then it’s over, right? If you really got in here and it meets expectations, a rise of 12% to this point is also fine.
53:08
You have to ask Zhu Yi about GUN. After the trumpet pattern breaks, there’s nothing to play with.
53:28
You must always remember, after breaking below the neck line, it needs to build a significant formation to come back for testing. It’s not just about the price coming back to this GUN. Currently, what do we see? Just a trend line is enough for him. You just need to give him this trend line. And you don’t need to think too much about it, right? Go long only after the trend line breaks, and stop loss if it drops back to new lows. As you can see, there is currently no breakout, so don’t consider going long.

54:12
Without LAYER, it breaks even at 40.41. It still needs to drop 33%. As long as Bitcoin breaks 105,500 points, it will stabilize; it will stabilize, and then it needs to rise; it needs to rise by 80%.
54:51
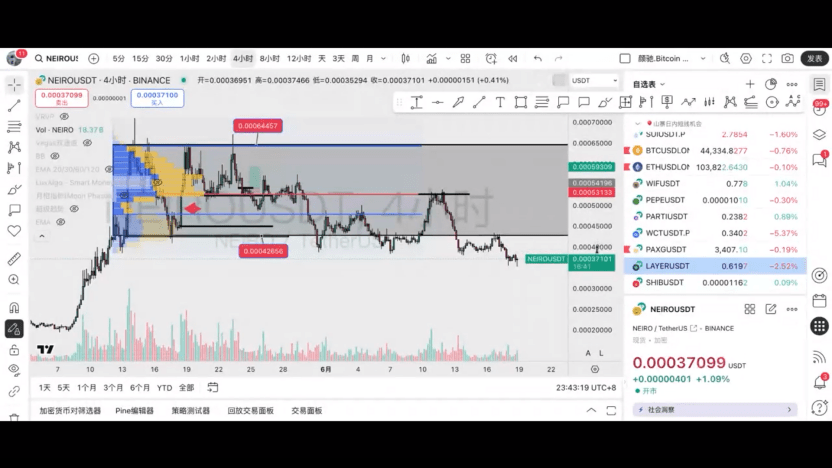
NERIO has broken this head, broken this head. But actually breaking the ice many times, like this place, hasn’t it? Before, it hadn’t created a new low yet. Look at this position; after it broke, didn’t it go for a long time? It went for a long time and then tested the previous consolidation area after breaking. The same goes for any coin. It has broken this head; for example, the previous consolidation area was here, right? Break below and can’t recover, break up and can’t go up, break down and can’t break above. If it continues to drop, this place continues to lower, or what kind of shape it makes is unknown. It can only be called strong after returning above this place. Otherwise, currently, don’t go long, don’t go long. UNI just said it very clearly.

58:04
How to select a range for the volume distribution chart? Big brother, you can choose wherever you want; if you don’t know where to select, you can see that I have now selected this volume distribution chart, right? So where do you want to measure? I want to measure this head, right? It hasn't broken before, so I definitely want to measure this head. After I measure, I know the POC is at this point. For example, it hasn’t risen yet; I measure here, and its POC is at this point.
58:32
So did it drop because of the news? Did it drop because of the disappearance of changes? For example, look. I cut the daily level. Before, when you saw it, it hadn’t risen yet. What I need to know is, for example, after it broke this neck line, where is your densest area of chips?
59:29
The network is stuck and can’t display; then let’s go home on the 22nd and teach again.

01:00:56
When it drops, buy WCT. WCT I mentioned before is a good coin; it is a good coin. However, because of this segment’s drop, this segment’s trend, in the short term, it can only stay around this place. For example, how long can it stay, then break through WCT? You can only add it to your watchlist. If you think the market is dropping a lot, you can buy a little; it needs a long time to recover. However, this project has a very good fundamental.
01:01:28
Then these two coins, PARTI and this one, are only played until September; I won’t play them after October. Because in October, these two will unlock in large amounts, so why wait until September? Now it’s June, so let’s see if it can rise when it drops in June and July.

01:02:00
Once it felt somewhat familiar; the previous CFX, I believe, should be similar to everyone’s pork account being cleared. Previously, I mentioned it was from 0.1 to 0.15, and it did reach 0.1, right? My name has also changed, so I believe our pork account should be cleared around 1.5; it hasn’t reached, but 10 has reached.

01:03:02
Yes, the position has arrived, but the time is wrong. I also changed my name at that time, right? I also changed my name a month ago.
01:03:45
May I ask if the resistance I drew on the hourly chart is 105250 and you on the four-hour chart; may I ask what my question is? Thank you. Your question is that I drew it with a four-hour chart, and you drew it with an hourly chart. No problem.
01:04:03
Because you drew it in one hour, and I drew it in four hours. And actually, don’t get stuck on specific points; you know? Don’t get stuck on specific points. I often draw for you; I always draw a range, right? Just about this range; you see, for example, an hour roughly draws this range. You can pull this range over; it doesn’t mean you have to stick to this exact point. What precise points can only scam your membership fee, understand? In trading, who goes to trade by clinging to point positions? You say the current price of Bitcoin is 100,000, or it’s over 10,000. It’s not 18,000. When Bitcoin’s price is 18,000 or 16,000, it’s easier to get stuck on a point. You say this place fluctuates by 0.37, which is 400 points; how can you get stuck on a point? It’s impossible to get stuck; it can only be in a range; it can only be in a range.

01:05:04
Previously, I also told everyone that the priority level of consolidation areas is high selling and low buying. Many times, you don’t dare to believe it will really go like this. But actually, if you look, it really goes like this. Consolidation area, you see if it will biu up again; I don’t know, but it’s in this place; hasn’t it not broken down, not broken through? Lock the upper boundary, lock the lower boundary.
01:05:53
What is PROMPT? Is this really what I recommended? I shouldn’t have recommended this coin. I actually said this many times; you have to see what I wrote, this long and flowery thing. You have to know I have to eat too; I need to make a living. We can look at the comments section.

01:06:58
Is it Guangzi? It should be widely announced, no doubt Guangzi. If you see me write flowery things, right? Just like and comment once.

01:07:41
Also about Binance's new coins, I will release a small research report on new coins on inevitable. Just take a look. I’m just releasing reports; this is just a report.
01:08:15
Then AAVE. The demand explosion point means what? It means you want to go long; this place, this range is also suitable for gambling. Then after it breaks down, decisively stop loss; can you dare to turn bearish? You look at it; can you dare to turn bearish? This place breaking down is usually to plunder this string of liquidity.

01:09:01
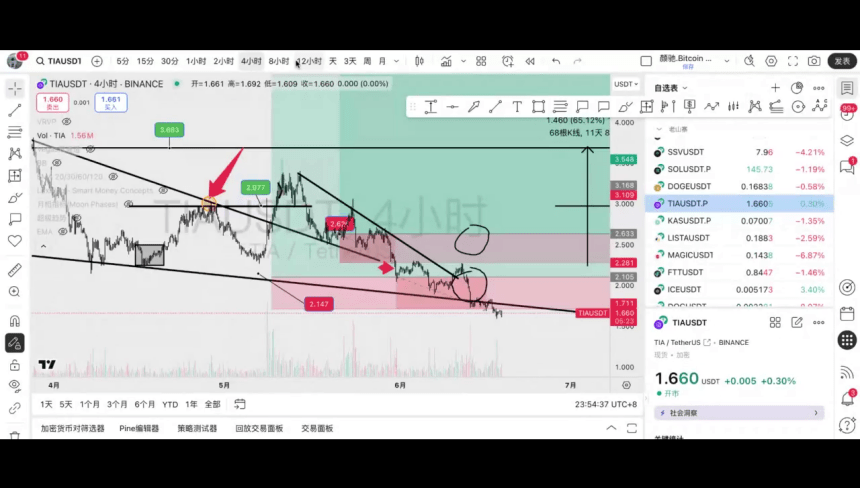
What to do with TIA? I also don’t know what to do. When it rises, you never ask me what to do? The controversy over TIA is always very large. You can go look; every time I share my views on TIA, I publish them directly in the square; otherwise, so many people wouldn’t ask, right?
01:09:24
Previously, it was sent out from this place, which should also be at this low of around 2.32. Then how much did it rise? It rose about 40%. When it rose 40%, it didn’t force much. So when it drops, you either stop loss at 1.7 or you stop loss at this place. Or you make a short line and stop loss at this place. You just stop loss at this place; there’s nothing to argue about.
01:09:57
I also got stuck at my spot cost of 3.1; it should be 3.1, spot cost contract cost of 2.2. So stop loss is just stop loss; there’s no need to worry about what to do; stop loss is just stop loss.
01:10:43
A stop loss is your cost of trading. When you understand this sentence, you will dare to face the stop loss directly.
01:10:58
Stop loss, then just stop loss. When it reaches the target, take profit, and then go to open the next order, right? Many of you are making a mistake now: you don’t dare to cut when you’re wrong, you don’t dare to stop loss, and after holding for a long time, you cut. Then start to follow up, follow up, check Twitter, see where to look, check the square, check Weibo. Then see who is supposedly impressive, then you follow them, and open the second order. If there’s no stop loss, it appears to be taking profit. For example, at some take profit positions, you feel like they earn too little. Obviously, Bitcoin has risen by 5000 points, and you only opened 0.2, earning too little. But others opened 20, 50, 80, 100; they might say they don’t need to earn 5000 points; they earn 2000 points, and that’s enough, right?
01:12:05
When you reach the position, just take profit, and wait for the next trading opportunity to appear. Don’t have too many fantasies about altcoins. In the last wave, I told Zhu Yidan that when altcoins rebound, I will definitely run at the cost price; I will run at the cost price. Some that I’m more optimistic about, I’ve earned 10% to 20%, but not more.
01:12:30
I feel really light now, you know? Very relaxed. I currently don’t have the burden of those altcoins. My largest holding in the exchange is BNB, then Ethereum, and then those altcoins. Excluding TIA, other altcoins add up to less than 100,000 USDT. Even if it drops by 50%, I can accept it. In the market, I am all in USDT; I actually hope you drop.
01:13:44
For example, at this place, I previously looked at BNB. I previously should have made a long position at 637, right? The alarm was triggered to make a long. Then how much did I win the first time, how much did I win the second time? I have also marked them. For example, the second profit taking was 670; how much did it rise at its peak? It rose to a maximum of 674. So why take profit at 670? The logic is simple; this place pulls over; isn’t it just 670?

01:14:19
You went long at this 637. At 637, first take profit, then take profit again. After each second profit, I always say that the remaining position should be held without notifying the cost defense. You can look at BNB at 50,000 too, right? You’ve already taken profit twice, you can do whatever you want. That order is done, and no further notification is needed.
01:14:44
Thinking about black swans every day is also very necessary. For example, like last year’s 24-year, 24-year at this place, on July 30, BNB’s price was still at 600, and then after 1, 2, 3, 4 days, its price was at 400. So can 550 reach? No problem, no problem. Now let’s look; this round of market is pushing along the daily level 576676, once, twice, three times, four times. So this time, we can also place our spot orders around 550 and 530, placing spot orders in this place.

01:15:33
Alright, OK, that’s the end of today’s live stream views.
🔸「Chizai Exclusive」revenue-sharing link: https://www.marketwebb.me/join?ref=YANCHI
Invitation code: YANCHI
