On June 25, 2018, BTC continued to oscillate at a high level, trying to be bearish without shorting, as global tensions intensified.
The situation in the Middle East has become extremely tense due to the escalation of the Israel-Iran conflict. Trump's stance continues to be firm against Iran, emphasizing the prevention of its nuclear program, while seeking diplomatic breakthroughs to avoid a full-scale war. He maintains support for Israel but cautiously avoids direct U.S. involvement. Recent diplomatic actions are focused on strengthening alliances with Gulf nations to counterbalance Iran. However, his policy faces challenges from domestic supporter fragmentation and the unpredictability of regional situations. The future trajectory depends on U.S.-Iran negotiations and the further development of the Israel-Iran conflict.
It can be seen that global tensions are rising risk aversion, which is beneficial for Bitcoin and gold. However, short-term volatility is increasing, investment risks are rising, and the situation of geopolitical conflicts is difficult to resolve in the short term, leading to a longer duration. The entire financial system's response to geopolitical risks has far-reaching implications.
Bitcoin has been oscillating at a high level for nearly a month. I have mentioned more than once that Bitcoin will oscillate for a long period, then rapidly rise for a while before adjusting again, because from the weekly perspective, this trend has persisted from 2023 to the present.
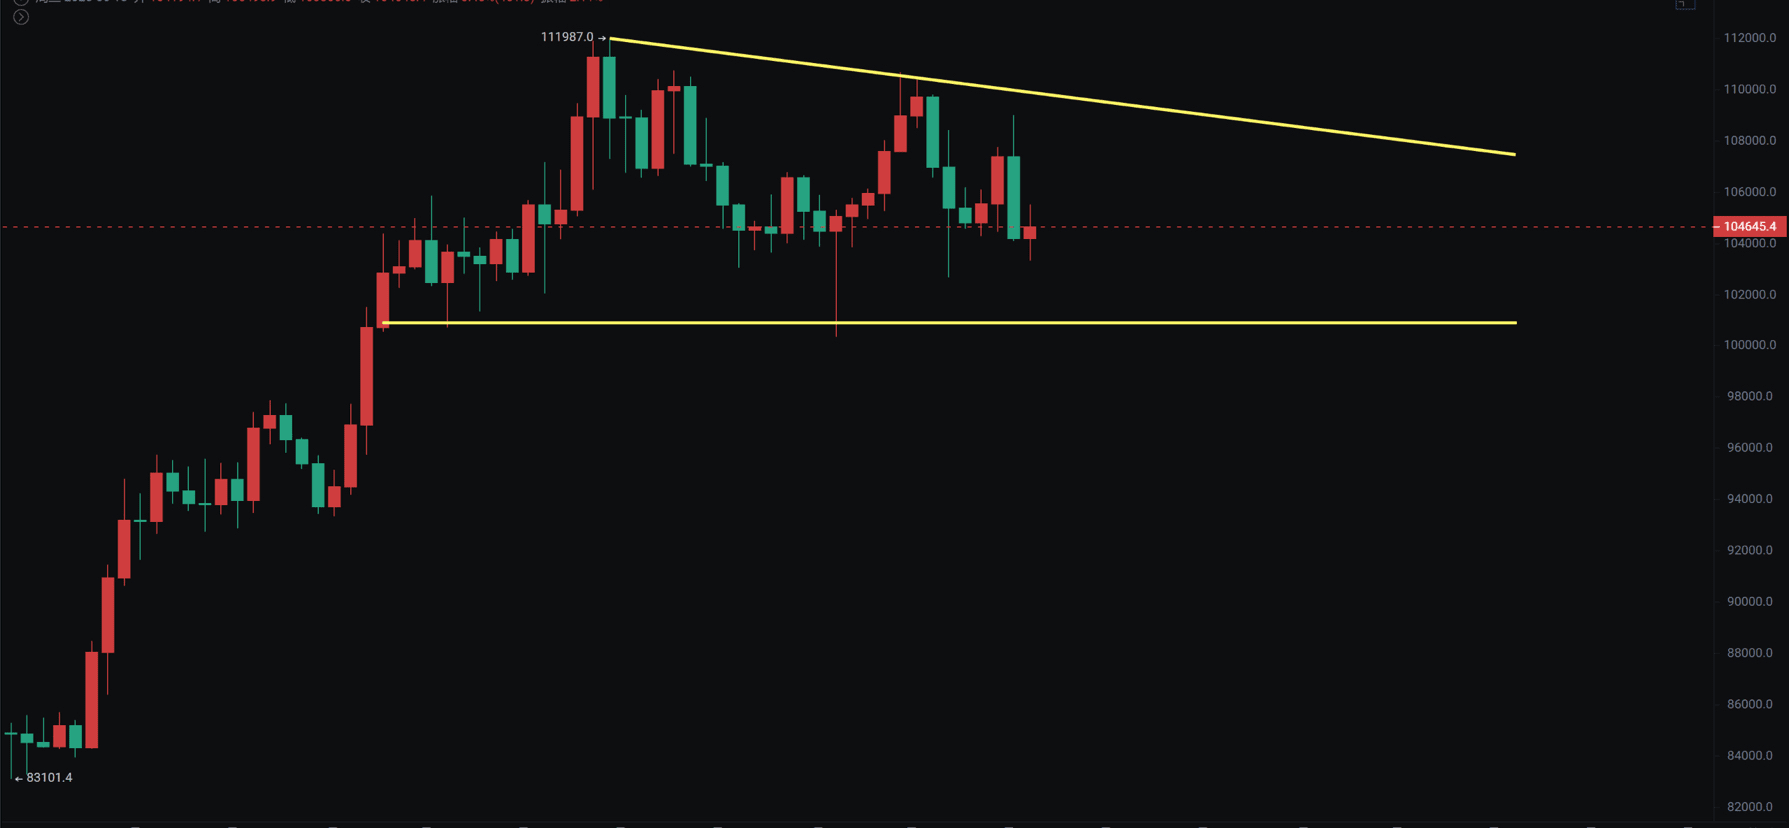
Bitcoin
The daily line still maintains a converging triangle, and is currently close to testing support around 100,000. In the short term, the bias is bearish, but personally, I lean towards being bearish without shorting. We are waiting for a better cost-performance ratio to enter in batches.
The daily MACD has not crossed the zero axis. If the price falls back below 107,000 again, it will be testing the support at 100,000. We can still place orders in batches at 97,000 and 94,000, waiting for undervalued opportunities.
Support: 94,000—97,000—100,000
Resistance: 107,000—110,000—112,000
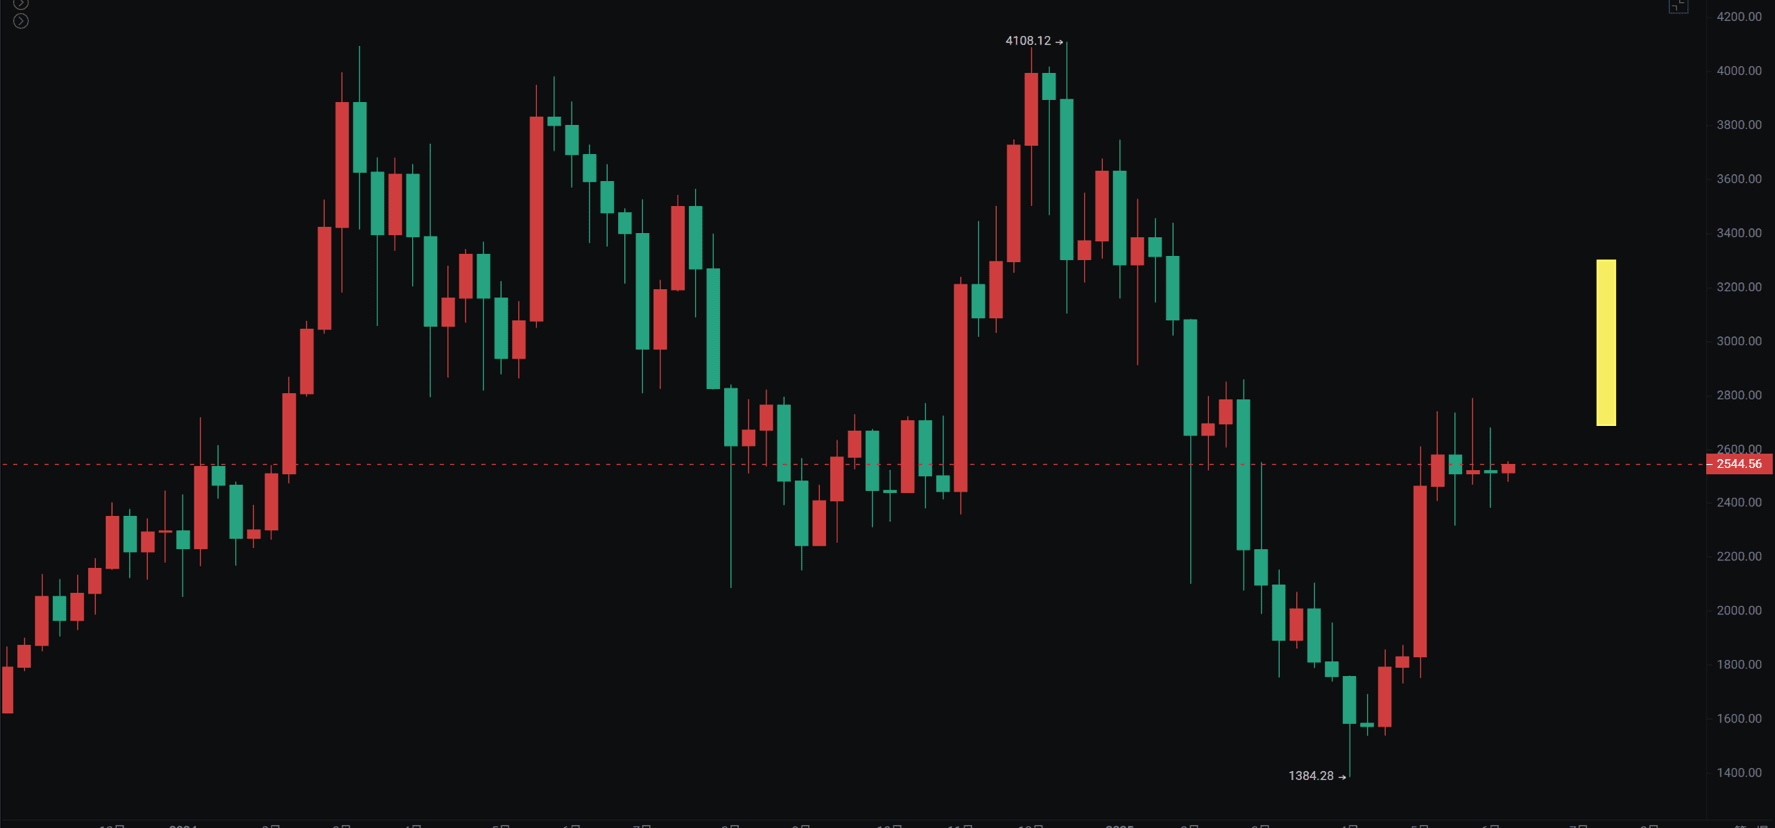
Ethereum
The weekly Ethereum candle has closed with 5 doji stars. If it closes another doji this week, it will be 6 doji stars, and it has been in a narrow oscillation for nearly 40 days. The overall strategy remains unchanged, with 2800 being a critical boundary between bull and bear markets. The weekly chart's pattern of throwing bricks to attract jade remains bullish. Therefore, any subsequent pullbacks or spikes will be great entry opportunities.
Support: 2100—2200—2300
Resistance: 2880—3300—4000