FOLLOW ME NOW!!
Coin- #Trxusdt
Signal- Long
READ MY POST CAREFULLY, SIGNAL IS DOWN TO MY POST
The chart indicates a bullish trend. The MACD is above the signal line, suggesting upward momentum. The RSI is at 57.90, signaling that the asset is neither overbought nor oversold, with room for upward movement. The price is consistently above the EMA ribbon, which is also aligned positively, with shorter EMAs above longer ones. The volume is increasing slightly, confirming buying interest. Overall, the indicators suggest a potential for upward movement, making this chart lean toward bullish sentiment.
Based on the chart analysis, the current trend appears to be bearish. The RSI (Relative Strength Index) is at 48.05, indicating a neutral market but leaning towards a potential bearish reversal as it approaches 50. The MACD (Moving Average Convergence Divergence) is showing a slight negative divergence with a MACD line close to the signal line, further supporting a bearish outlook. The price is also trading below the Bollinger Bands middle line, indicating a weak bullish momentum and potential for further downside.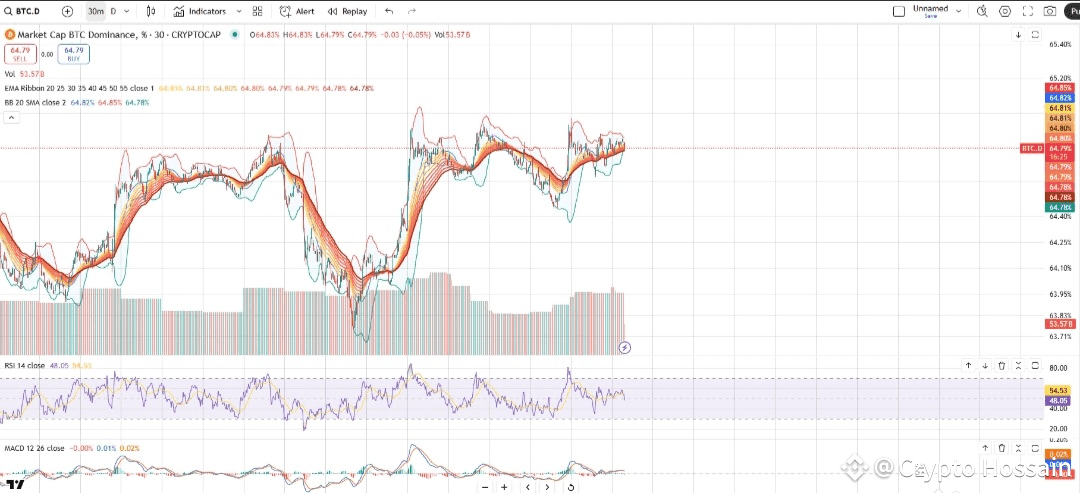
The chart shows a neutral to slightly bullish trend for TRX/USDT. The price has recently formed a base around 0.27 with strong support levels. Liquidation levels suggest that there is more sell-side pressure around the 0.28 level, where significant liquidation clusters are visible. However, the price has managed to bounce off the lower levels, indicating a potential for upward movement. The lack of heavy resistance above 0.28 suggests a moderate bullish trend, but caution is advised if liquidation pressures rise.
Signal-
Entry- 0.27
TP- 0.28