Today, I want to share this set of cryptocurrency 'swing trading' strategies, which, after years of practical testing, has achieved an average win rate of 80%. This is quite an achievement in the cryptocurrency trading community.
Swing trading is in contrast to short-term and long-term trading.
It is neither frequent trading, relying on short-term fluctuations to accumulate profits, nor long-term trading that ignores short-term fluctuations, only capturing the starting and ending points of a trend. Therefore, swing trading balances the relationship between volatility and trading frequency, and is considered a balanced trading strategy.
In the study of swing trading, one of the most famous trading tools is the three-line formation.
1. The most basic unit of market structure
We know that a small swing consists of a peak and a trough. It can align with the main trend or may be a secondary retracement. Many successive oscillations constitute a trend, but there will always be a swing's peak or trough that acts as a reversal point for this trend, which is the focus of our discussion today.

To understand the three-line point, we first review the top doji or bottom doji.
At the end of a trend, such as at a peak, a bullish candle followed by a doji and then a bearish candle forms the common evening star pattern, signaling a peak.
However, the evening star is not an absolute signal for a decline.
Generally speaking, if accompanied by increased trading volume, it may be a more definitive signal for a peak; additionally, if the trend is rising, it may just be a normal resistance pattern.

The three-line formation provides a clearer reversal signal.
A simple three-line formation is similar to the morning star and evening star, but in the three candlesticks, the high and low of the middle candlestick must be lower than the surrounding two candlesticks, forming a strict reversal signal.

In most cases, the three-line formation usually appears in the form of a complex three-line formation.
1. In an ascending three-line formation, the lows of these small candlesticks may be slightly lower than the candlesticks on both sides, but the highs must be lower than the middle candlestick, and the lows must also be higher than the middle candlestick. You can understand this as being contained within the middle candlestick.
In a descending three-line formation, the highs of these small candlesticks are all below the three-line, and the lows are all above the three-line, also included in the middle candlestick.
3. The three-line formation exists at the beginning and end of every swing.

You can understand that a complex three-line formation is a broader form of the evening star or morning star, containing more variations of microstructures, which can help us better confirm reversal points.
As shown in the figure, ① is not a three-line formation, although our conventional impression is that after a quick downturn, a small candlestick represents a bottoming signal, but the middle candlestick does not have a lower low. In ②, although there is no quick downturn, the candlestick body is relatively short, but we do see a lower low in the middle candlestick, which is an effective three-line formation.

The three-line formation, as a basic unit of microstructure, actually represents a rapid transformation between two trends. Unfortunately, the inventor of the three-line formation also stated that it is an analytical framework of 'time and price,' unable to capture such signals from a quantitative perspective.
In the EBC order flow tool, the introduction of volume concepts compensates for this shortcoming. As shown in the figure, this is also a structure of a three-line formation, but through the order flow tool, we find that at the bottom of the middle candlestick, a POC appears, which is the price level with the highest trading volume in a single candlestick, indicating that someone is starting to support below, which is a clear support signal.

At the bottom of the chart, the real-time statistics of the net number of buy orders minus sell orders in a single candlestick is recorded as Delta. It can be observed that the Delta corresponding to the middle candlestick shows a long lower shadow, indicating that market net positions have changed from net short to net long, and market sentiment has rapidly shifted. These indicators greatly improve our accuracy in predicting market sentiment and tendencies.
The second function is that the three-line formation can help us determine the swing range because it exists at the start and end of each swing.
Due to the similarity of swings, we can estimate the length and height of the swings by confirming two three-line formations, which provides us with reference entry price levels for the next swing.

2. Normality and Reversal
As mentioned earlier, confirming reversal points is challenging because you cannot determine whether you are at the top or bottom of the trend or in the middle of the trend.
The three-line formation fully absorbs the ideas of bullish norms and bearish norms. In bullish norms, if the lows and highs continually rise, it indicates the continuation of an upward trend; conversely, the bearish norm follows a similar logic.
As shown in the figure, in an upward trend, if a new low is lower than the previous low, it indicates that the trend has reversed.


But this does not mean that this position can be sold or bought.
Since swings may repeatedly switch, we need to confirm multiple signals. As shown in the figure, if a three-line formation appears at the bottom of a trend, and the subsequent peaks and troughs of several swings also exhibit three-line formations without overlapping the lows of 0 and 2, it indicates that the trend begins to confirm. Thus, near the closing price position of 4 is a very good buying opportunity.

More reliable are the double bottom and triple bottom patterns.
If two three-line formations appear at a price level, it means the bottom has confirmed the reversal signal multiple times. If the next peak rises, it indicates trend confirmation, then the closing price near the next reversal point is an entry opportunity.

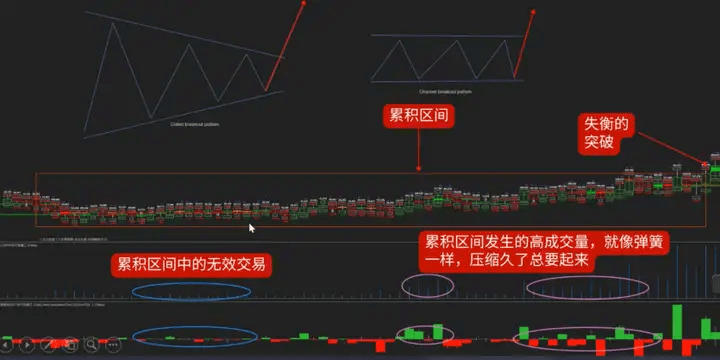
The essence of a trend is to continuously break through price ranges. Before the breakout, there will be box oscillation, and after removing the uncertain positions in the market, a rise will occur. If the price range cannot be broken, it is generally the institutions distributing at the top, leading to a drop below the current range.
This is also why, in three-line formation analysis, one must wait until the high point rises and does not overlap with the middle candlestick before buying, as this is a confirmation signal for breaking out of the box.
The recent introduction of (Wyckoff 2.0) in EBC elaborates on this market structure, showing that trends actually move from one value range to another, and the price range is closely related to the distribution of trading volume.

By tracking trading volume distribution, we find that the market always follows a cycle. Identifying which stage you are in is key to capturing the complete trend and timely exiting.
3. Time and Energy Dimensions
The analysis of the three-line formation also introduces the dimensions of time and energy.
The time dimension primarily observes the continuity of trends. For instance, during a trend, every time a secondary retracement occurs, it produces three candlesticks. However, if a three-line formation appears at a small wave peak, and 5-6 candlesticks appear during the retracement, it indicates that selling pressure is beginning to rise, threatening the bullish pattern maintained by the bulls.
The possibility of a reversal here is very high; if the low here is below the previous low, it is basically a very clear signal.

Energy indicators primarily consider the accumulation of market momentum.
As mentioned earlier, the three-line formation itself is a combination of candlesticks at two swing reversal points. Therefore, when at a high level, market selling pressure is evident, while at a low level, buying pressure becomes more apparent.
If the market continues to oscillate at a low level, the longer this process lasts, the stronger the accumulated momentum.
At this point, if two higher peaks and troughs appear, it meets our analysis of the rising trend of the three-line formation, and with increased trading volume, the closing price of the second trough will be an excellent buying bottom.

It is important to note that if there is no volume in the market, and the trend continues to rise, the momentum to the downside will accumulate better. Therefore, once a three-line formation appears accompanied by volume increase, the previously compressed sell orders will be released, pushing the trend down further; conversely, it will be the buyers' main stage.

Through the EBC order flow tool, we can visually observe changes in market volume, and combined with Delta data, we can directly see changes in net positions, especially when market net positions are continuously accumulating, the accumulated upward momentum is often more pronounced. Once net positions increase significantly, it can reflect changes in market sentiment.
In summary, the three-line formation is not a complex technical pattern; it is somewhat similar to the commonly used doji. However, it incorporates Charles Dow's analysis of bullish norms and provides an entry point for confirming swings, based on time and energy dimensions, further exploring the essence of market structure balance.
Since swing trading is essentially a type of oscillation analysis, combining the three-line formation with indicators like RSI and MACD can more clearly identify divergence signals, which can help us better participate in the market.