
First, look at the monthly chart. Last month, although there were new highs, the monthly closing did not break the previous early year high. This indicates that although the overall trend is bullish, there was no real breakthrough at the 110,000 mark (previous early year highest point was over 109,000). This can be seen as a false breakout. Only a true breakout could lead to a one-sided market. It might surge and provide opportunities to reach many people's ideal target of 13-15 or even higher. It is clear that the market tells us that this probability has decreased. Therefore, the closing of this month's monthly line will be crucial. As long as this month's monthly line closes above 111,980, there is a chance to reach 13-15. If this month closes with a bearish line, and it is a large-bodied bearish candle with little to no lower shadow, and it is close to reversing last month's monthly line, then it is clear that the trend may reverse. Note that it is a possibility. Because from the monthly perspective, the overall trend is still bullish. If this month's closing is as I mentioned, a bearish candle, according to candle analysis, it may enter a continued adjustment phase. There are still 2 weeks left in this month, so no one knows what will happen. Sometimes, a one-hour candle can change the overall situation of a large cycle, let alone there are still 2 weeks.
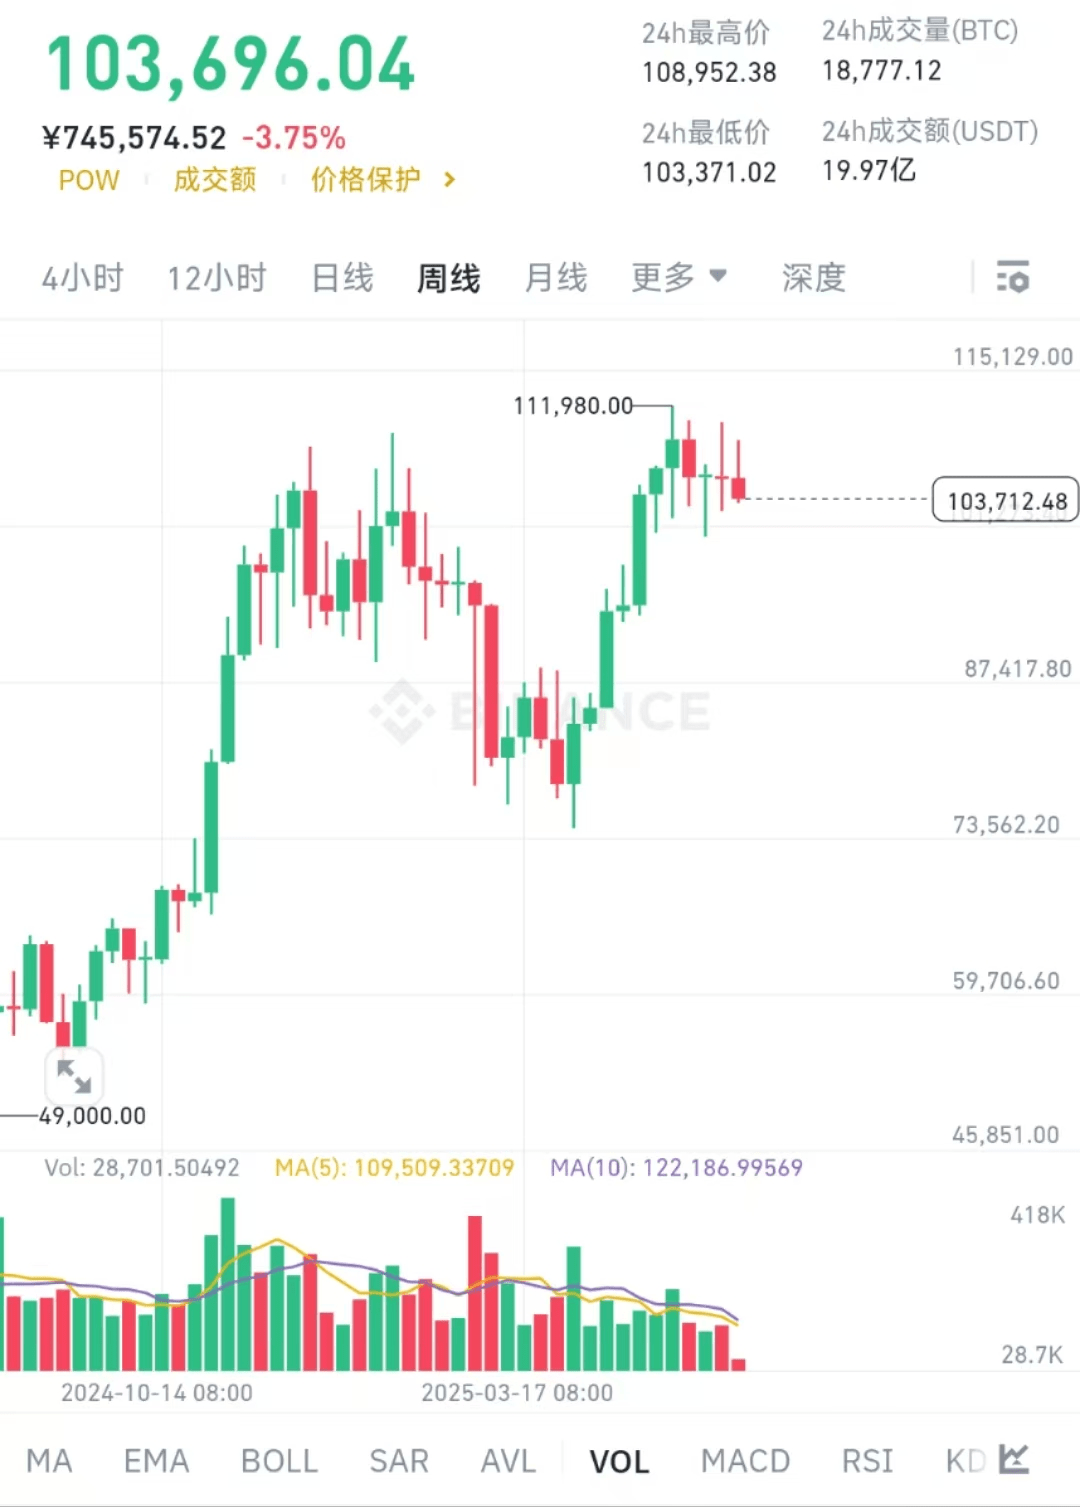
Looking at the weekly chart, 10-11 has been oscillating for 5 weeks, and this week is the sixth week. The 11 mark is a key level in a larger cycle. Generally, in a bull market at certain key points, the adjustment period is either a month or several months. This means that if, after more than a month, you still do not see a breakthrough in this 10,000-point oscillation range, you should consider whether the market is going to have problems. This is viewed from the time node. Now, in the sixth week, combined with the current market, it is a bit dangerous! Of course, until the last moment, you never know. Last week on the weekly chart, after the drop, there was a rebound, indicating some support around 10. Last week, there was a surge and then a drop, leaving a long upper shadow on the weekly line, and the closing price was also not good, close to the previous week's close, in the middle of the oscillation range, indicating a continued demand for probing the bottom this week. According to past patterns, there is a certain probability of breaking 10 and heading towards the 9.8-10 range. On Monday of this week, I had already opened a short position around 107,000, but unfortunately had to set a stop-loss. I waited until after 1 AM, and while waiting, I fell asleep. When I checked during the day, it had already come down, and I missed the best shorting opportunity. So I didn’t participate further. I personally do not like to participate in long or short positions at mid-range positions because whether it is a declining process or a rising process, if you position in the middle, it may cause you to keep getting stopped out. You only won’t get stopped out when encountering a consistent one-sided pattern. So knowing that it will drop, you don’t necessarily have to take a position. It’s hard to say, who told me I’m not the major player?
From the 4-hour level, the bearish trend is obvious, and do not participate in long positions. Because in a bearish trend, if you go long, the lows keep getting lower. Sometimes encountering a continuous decline, it will keep falling, even crashing. Trying to catch a small rebound in a bearish trend may lead to losses.
9.8-10 interval, watch for signs of a stop in the decline. If there are any, long positions are worth considering. Make sure to set stop-loss orders.
In summary, whether 111980 will be the major top of this round, or a phase major top, can be seen as 70% after this week's closing, and 90% after this month's closing. In anything, there is no 100%!