Bitcoin (BTC) kicked off the new week on a high note by surpassing the $107,500 mark, marking a positive signal for the price increase. Although the price is currently just slightly below the historical peak, both whales and retail investors are steadfastly holding their positions. According to Darkfost, a contributor to CryptoQuant, the amount of Bitcoin transferred to the Binance exchange from these two groups has dropped to its lowest level since the beginning of the current cycle – a sign that they are either waiting for clearer signals from the macro environment or simply maintaining confidence in Bitcoin's long-term prospects.
Analyst Tony Sycamore from IG Markets states that Bitcoin is fully capable of testing the previous peak near $112,000, and may even reach the $116,000 – $120,000 range, as long as it maintains above the key support level of $95,000.
Not only Bitcoin, but Ether (ETH) is also experiencing strong demand. Last Sunday, Ethereum wallets holding between 1,000 and 10,000 ETH accumulated more than 818,410 ETH – equivalent to about $2.5 billion – raising total holdings from 11.9 million ETH a year ago to 16 million ETH.
Will Bitcoin be able to surpass the old peak of $111,980 this time? And will the altcoins join in the price increase? Let's analyze the charts of the top 10 cryptocurrencies to find the answer.
BTC Technical Analysis
The S&P 500 index (SPX) reversed from the level of 6,059 on Wednesday, indicating that the bears are actively defending the resistance area from 6,000 to 6,147.

The index has bounced from the 20-day exponential moving average (EMA) at 5,938, indicating that sentiment remains positive and each adjustment is seen as a buying opportunity. Buyers will try to push the price up to the 6,147 area.
If the price breaks and closes below the 20-day EMA, a deeper correction may begin. At that point, profit-taking selling from short-term investors could pull the price down to 5,767, followed by the 50-day simple moving average (SMA) at 5,680.
DXY Technical Analysis
The USD index (DXY) is witnessing a fierce tug-of-war between the bulls and the bears around the level of 97.92.

The bears dragged the price below the support level of 97.92 on Thursday, but the bulls reclaimed this level on Friday. However, buying pressure is struggling to maintain the price above 97.92, indicating that the bears are selling on any recovery. This increases the likelihood that the price will continue to decline to 95.67.
Conversely, buyers need to push and maintain the price above the moving averages to weaken the downward momentum. At that point, the index could bounce to the upper resistance area at 102.
BTC Technical Analysis
Bitcoin surpassed the 20-day EMA ($106,202) on Monday, indicating that the bulls are actively defending the 50-day SMA ($103,887).

The bulls will try to strengthen their position by pushing the price to $110,530 and then to the neckline of the inverted head and shoulders pattern. If it closes above the neckline, this bullish pattern will complete with a technical target at $146,892.
However, the bears will certainly have other plans. They will aim to protect the resistance above and push the price below the 50-day SMA. If successful, the BTC/USDT pair may test the important support level at $100,000.
ETH Technical Analysis
Ether closed below the 20-day EMA ($2,580) on Saturday, but the bears could not extend the decline to the 50-day SMA ($2,412).
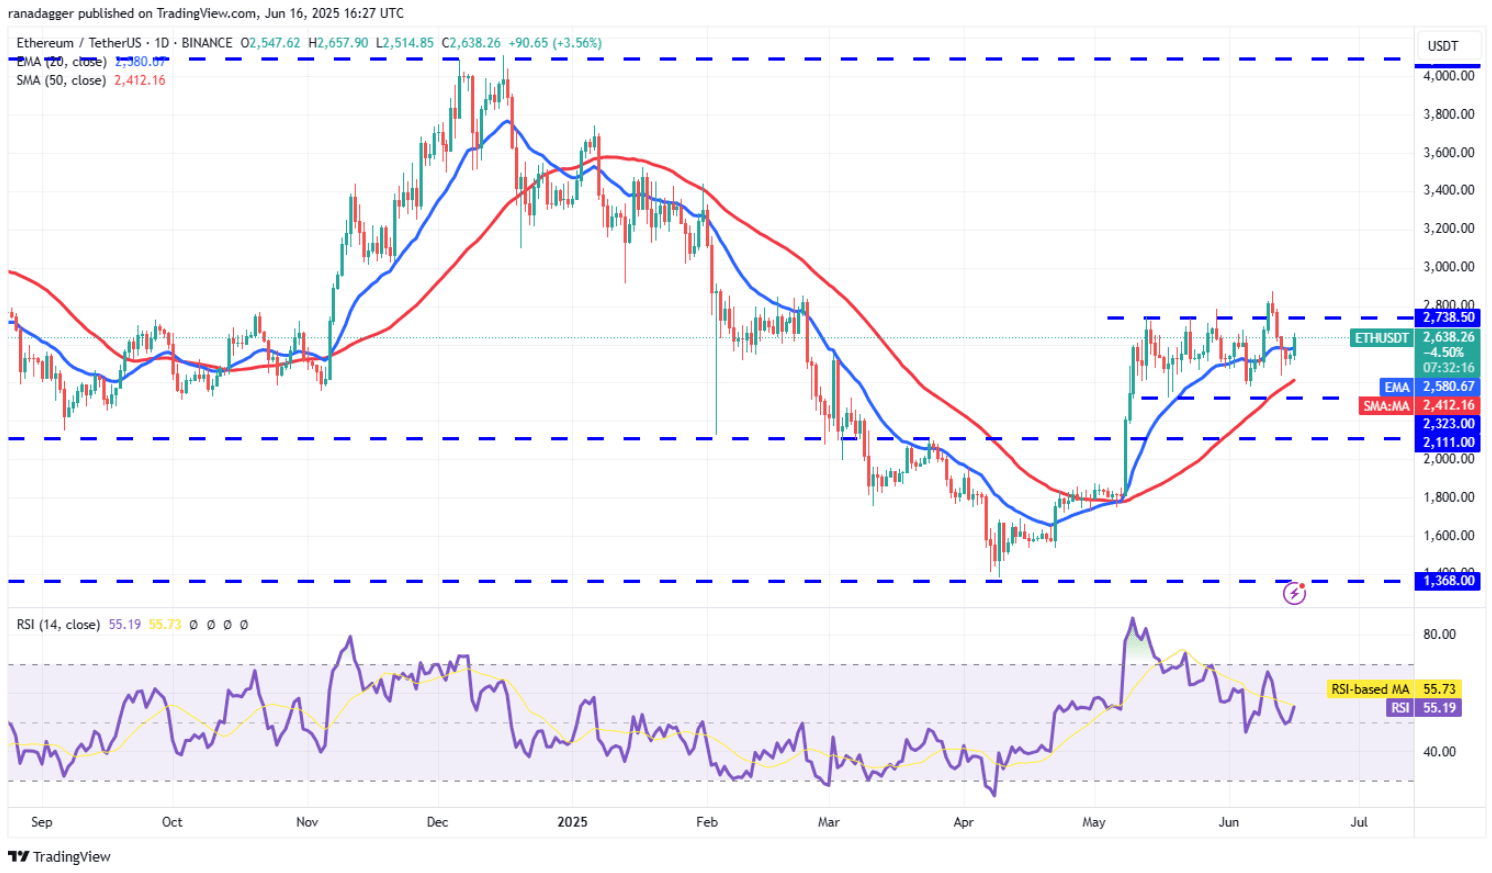
The bulls have pushed the price back above the 20-day EMA, indicating buying strength when the price adjusts. The ETH/USDT pair could rise to $2,738 and then to $2,879. The bears will try to defend the upper resistance area, but if the bulls break through, the price could continue to rise to the $3,153 area.
Conversely, if the price sharply declines from the resistance area, this pair may trade within the range of $2,879 – $2,323 for a while. The short-term trend will turn negative if the price closes below $2,323.
XRP Technical Analysis
XRP has fluctuated between $2 and $2.65 over the past few days, indicating buying strength at the support level and selling strength near resistance.

Price fluctuations within this range are likely to continue to be erratic and unpredictable. If buyers maintain the price above the moving averages, the XRP/USDT pair could rise to the resistance level at $2.65. The bears are likely to exert strong pressure at $2.65, as if this level is broken, the price could be pushed up to $3.
The trend will turn negative if the price breaks and closes below the support level of $2. At that point, the pair could test the important area at $1.61.
BNB Technical Analysis
The bulls are trying to push the BNB price above the 20-day EMA ($656), which could keep the price moving sideways in the $634 to $693 range for a while longer.

The 20-day EMA is moving sideways and the RSI is fluctuating near the neutral zone, indicating that neither side has a clear advantage. If the price holds above the 20-day EMA, the BNB/USDT pair may rise to $693. The bears will try to prevent the upward momentum at this level, but if the bulls prevail, the price may reach $732.
Conversely, the bears will need to push the price below the support level of $634 to regain control. At that point, the pair could drop deep into the $580 range.
SOL Technical Analysis
Solana (SOL) bounced from the support area of $140 on Saturday and reached the moving average on Monday, indicating strong buying at lower price levels.

Both moving averages are currently moving sideways, while the RSI is near the neutral zone, indicating that the SOL/USDT pair is likely to fluctuate between $140 and $185 in the coming days.
The next trend may be established if the price breaks above the $185 range or drops below $140. If the price sharply declines from the moving averages and breaks through the $140 level, the pair could plunge to $110. Conversely, if it breaks through $185, SOL could soar to $210, and then to $220.
DOGE Technical Analysis
Dogecoin (DOGE) remains above the $0.16 level, but its inability to rally strongly suggests that the bulls are not yet aggressive.

The 20-day EMA is sloping downwards ($0.19) along with the RSI in the negative zone increases the risk of the price breaking through the $0.16 level. If this occurs, the DOGE/USDT pair could drop to the support zone of $0.14. The bulls will make strong efforts to defend the $0.14 level, as if broken, the price could continue to decline to $0.10.
Buyers are facing a tough challenge. They need to overcome the resistance level of $0.21 to pave the way for a rise to the $0.26 range. A new uptrend could begin if the price breaks above $0.26.
ADA Technical Analysis
The Cardano (ADA) bulls are trying to defend the $0.60 level, but the current recovery lacks strength, increasing the risk of breaking this support level.

The 20-day EMA is sloping downwards ($0.67) and the RSI is in the negative zone, indicating that the bears are in control. If the price drops from the moving averages and breaks through $0.60, the ADA/USDT pair could plummet to $0.50.
The bulls need to push the price above the moving averages to avoid the risk of a deep decline. If successful, the price may rise to the downward trend line, where the bears are likely to create strong pressure.
HYPE Technical Analysis
Hyperliquid (HYPE) has resumed its upward momentum after the bulls pushed the price above the resistance level of $44 on Monday.

If the bulls maintain the price above $44, the HYPE/USDT pair could continue to surge toward the next target of $50. This move would also negate the negative divergence signal forming on the RSI, indicating that the bulls have regained control of the market.
The 20-day EMA ($37.71) is an important support level to watch on the downside. If this level breaks, short-term investors may take profits, causing the price to adjust to the 50-day SMA ($30.37).
