Before the price enters the main rising wave, the main force often washes the dish to clear away floating chips and reduce the cost of rising. Common washing dish methods include:
Suppression washing dish
The main force causes the price to drop rapidly by selling part of its chips, creating a panic atmosphere. In this way, the price may experience a significant drop in a short period, leading some investors to mistakenly think the trend has reversed, and thus sell their valued coins.

Consolidation and oscillation washing dish
The main force lets the price oscillate for a long time within a relatively narrow range, wearing down investors' patience. Investors holding this coin may choose to sell it to seek other investment opportunities when they see the price not rising for a long time.
Pull-up and drop washing dish
The main force first pulls up the price to attract followers to buy in, then suddenly lets the price drop. Investors who buy in on impulse may panic sell due to paper losses.
MACD sees through the main force's washing dish scam
Divergence phenomenon
1/ Bottom divergence
During a price decline, if the price makes a new low, but the MACD indicator's DIF line or MACD histogram does not make a new low in sync, this is called bottom divergence. This often indicates that the downward trend of the price is about to end, and the main force may be conducting a final wash by suppressing the price.
For example, if the price drops from 10 to 8, then to 7, continuously making new lows, but at this point, the MACD's DIF line rises from -0.5 to -0.3, this shows bottom divergence. This indicates that although the price is falling, the downward momentum is weakening, and the main force may be secretly accumulating, leading to a possible price reversal and entering the main rising wave.
2/ Top divergence
During a price increase, if the price makes a new high, but the MACD indicator's DIF line or MACD histogram does not make a new high in sync, this is called top divergence.
However, during the washing dish operation before the main rising wave, the main force may create a short-term illusion of top divergence. At this time, it is necessary to combine the position of the price and other indicators for comprehensive judgment.
If the price appears to show top divergence at a relatively low level, but trading volume does not show significant signs of unloading, and other technical indicators do not show clear sell signals, then this may be a means of washing dish by the main force, aiming to scare away those investors who do not conduct comprehensive technical analysis.
Histogram changes
1/ Green histogram shortens but price does not fall
In an upward trend, the green histogram of MACD represents bullish strength. When the green histogram starts to shorten, it is generally considered a signal of weakening bullish strength.
However, if during the washing dish phase before the main rising wave, the main force may reduce the green histogram by selling a small amount of chips, but the price does not show a substantial decline.
At this time, if investors only sell their coins based on the shortening green histogram, they may be easily washed out.
For example, during an upward process, the MACD green histogram gradually shortens, but the price only fluctuates within a small range and does not show a significant pullback, which may be the main force washing the dish.
2/ Red histogram shortens but price does not rise
In a downward trend, the red histogram represents bearish strength. When the red histogram shortens, it usually indicates that bearish strength is weakening.
During the main force's washing dish process, there may be instances where the price remains low while the red histogram continues to shorten, but the price does not temporarily rise.
This indicates that the main force may be secretly accumulating, and once the accumulation is complete, the price may enter the main rising wave.
Crossing of DIF line and DEA line
1/ Second golden cross
After the price stabilizes following a decline, the MACD indicator may show the DIF line crossing above the DEA line to form a golden cross. If the first golden cross is followed by a slight price increase and then a pullback, but the DIF line does not cross below the DEA line, then forms a golden cross again upwards, this is the second golden cross. The second golden cross is often a strong signal that the price is about to enter the main rising wave, and the main force may have conducted small-scale washing operations after the first golden cross, while the second golden cross indicates the washing is over and the rise is about to begin.
For example, after a period of decline, MACD shows the first golden cross, the price rises from 12 to 13 and then pulls back to 12.5, but at this point, MACD forms a golden cross again, and then the price quickly enters the main rising wave, rising to 18.
2/ Refusal of death cross
In an upward trend, when the price experiences a brief adjustment, the DIF line may approach the DEA line, but does not form a downward death cross.
This indicates that the main force is only conducting slight washing, and the upward trend has not changed.
For example, during an upward process, a slight adjustment occurs, and the MACD's DIF line quickly approaches the DEA line, but just before crossing, the DIF line pulls away again, and then the price continues to rise, entering the main rising wave.
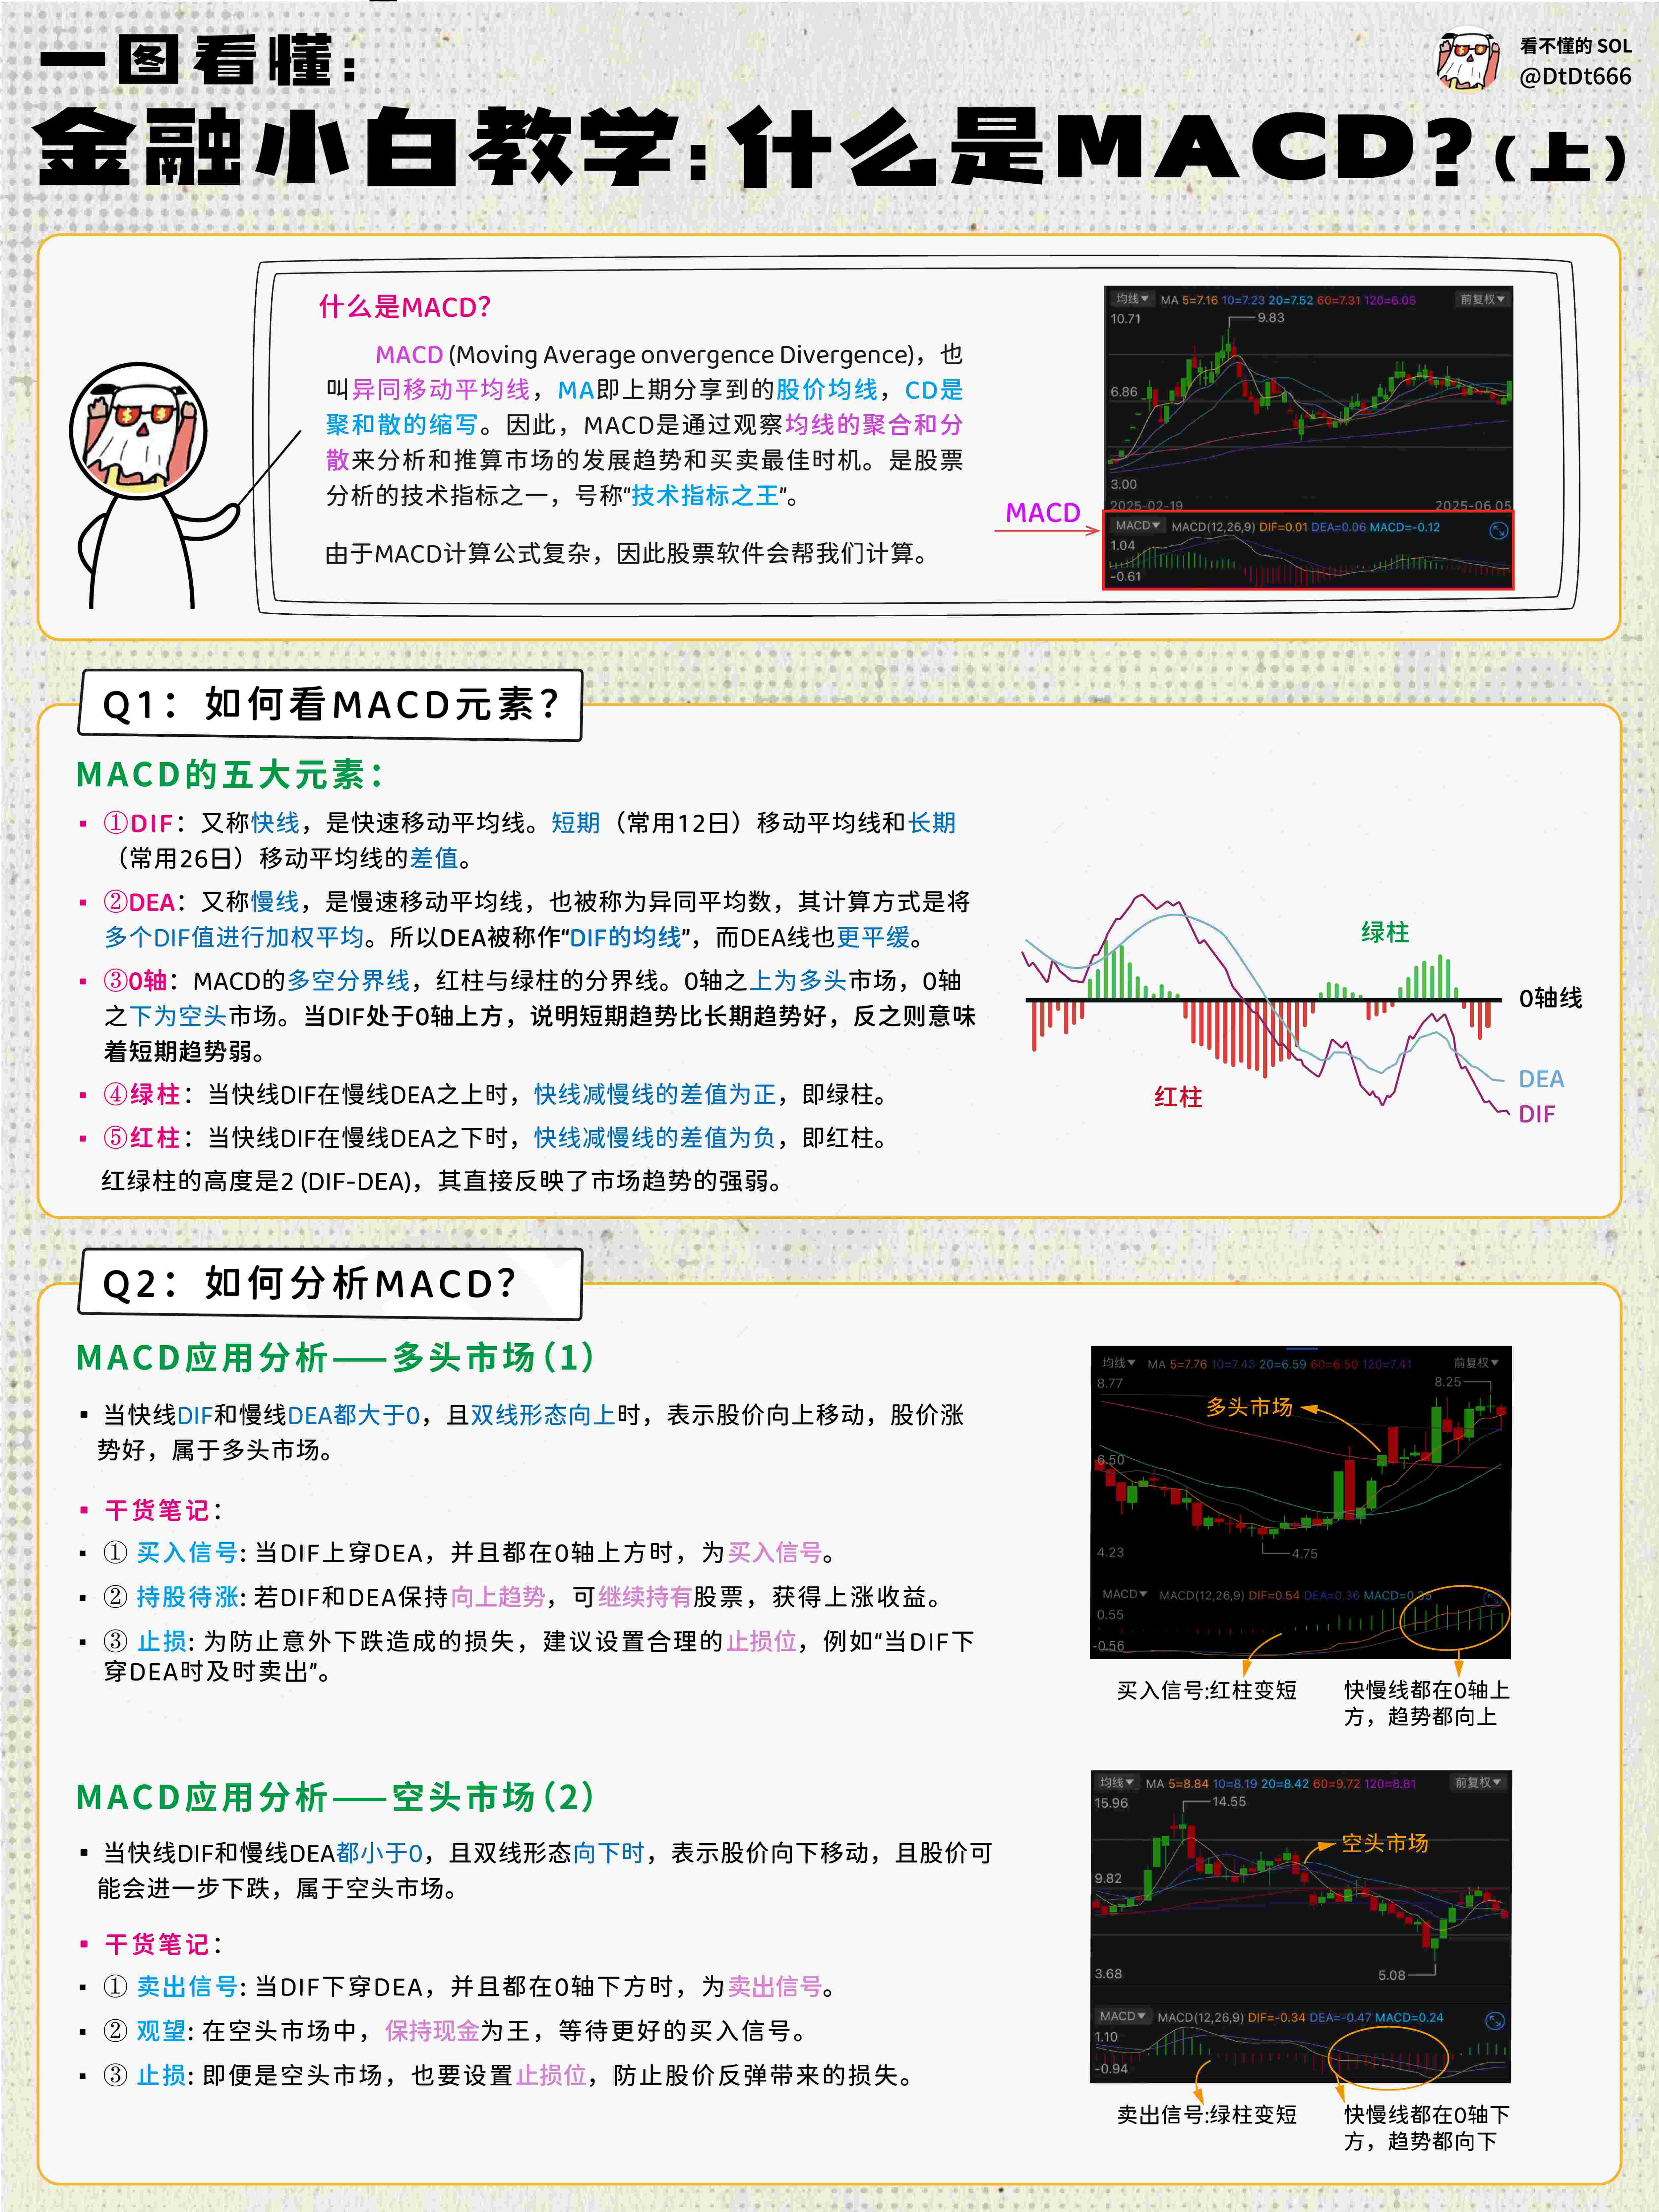
How to read the MACD indicator?
The MACD indicator consists of four parts, including the DIF line, DEA line, MACD histogram, and zero line. Each part represents different data derived from the original chart, simply to allow us to interpret it in a deeper but intuitive way, hence the birth of the MACD indicator.
Components of the MACD indicator
Here are some introductions to these four parts:
MACD line (DIF line/fast line)
The fast line of MACD: The MACD line is also called the DIF line (Differential Line), which is the difference between the short-term moving average (12 EMA) and the long-term moving average (26 EMA).
The existence of the MACD line is to analyze short-term price changes. The MACD line or DIF line can be positive or negative. MACD fast line = Short-term average line - Long-term average line
Positive MACD line: Represents that the short-term moving average value is greater than the long-term moving average value, which means that the short-term average price of the product is higher than the long-term average price, indicating that the financial product is in an upward trend.
Negative MACD line: Represents that the short-term moving average value is less than the long-term moving average value, meaning the short-term average price is lower than the long-term average price, indicating that the financial product market is in a downward trend.
The MACD line is also called the fast line because it is most sensitive to changes in market prices.
Signal line (DEA line/slow line)
The slow line of MACD
Simply put, the signal line (slow line) is the average value of the MACD line over a certain period in the past (usually 9 days).
Because it is based on past MACD data for analysis, it is also called the slow line.
The existence of the signal line is to capture more long-term trends.
Signal line/slow line = ∑(n MACD fast lines) / n
n = the time period we want to choose
The appearance of the slow line is to allow us as traders to discover trading opportunities more quickly. This is the key point and the knowledge we will learn in the next chapter.
MACD histogram (Histogram / Divergence)
The histogram of MACD
The MACD histogram was created to understand the difference between the DIF line and the DEA line. With the histogram, we can see the difference more clearly. MACD histogram = DIF line - DEA line
The histogram is also divided into positive or negative values. From these histograms, we can know: Histogram is positive: The fast line (DIF line) is above the slow line (DEA line).
Histogram is 0: The fast line (DIF line) is equal to the slow line (DEA line), which is an intersection point.
Histogram is negative: The fast line (DIF line) is below the slow line (DEA line).
Zero line
As a reference level, it separates the fast line and slow line from positive and negative values, serving as a boundary line, allowing us to clearly know which area the current MACD data is in.
Usage of the MACD indicator
The MACD indicator has many uses, with the three most common ways being to find the following information through MACD:
How to use the MACD indicator to observe price trends?
The simplest way to use the MACD indicator is to observe the trends in financial product trading, with the most common applications including forex trading and stock, cryptocurrency trading. Trends in trading can be divided into two types: upward and downward trends.
Uptrend: When both the fast line and slow line are above the zero line, then the coin is generally in an uptrend.
Downtrend: When both the fast line and slow line are below the zero line, then the coin is generally in a downtrend.
How to use MACD golden cross and death cross to find buy and sell points?
Using the MACD indicator to find buy and sell points is one of the most common analysis methods. By identifying the golden cross or death cross, we can find long and short points. The following is an example using EUR/USD:
MACD golden cross: When the fast line (blue line) breaks through the slow line (orange line) from below, it is called a golden cross, which is a good buy or long signal reference.
MACD death cross: When the fast line (blue line) breaks down through the slow line (orange line) from above, it is called a death cross, which is a good sell or short signal reference.
How to identify trend turning points through MACD divergence?
This is an advanced usage of the MACD indicator. When the price trend and the MACD indicator show inconsistent trends, there is an opportunity for MACD divergence to occur. Simply put, investors' emotions and views have changed regarding the price trend, believing that the price of this financial product does not match its actual value.
The appearance of MACD divergence is a warning and can be divided into two types, providing investors with potential buy and sell signals:
MACD top divergence: When prices make higher highs, but the MACD line makes lower lows, it forms a top divergence. This indicates that the momentum of price increase is weakening, signifying that the market is actually skeptical about the subsequent price increase, so the death cross following the top divergence can also be viewed as a sell/short signal.
MACD bottom divergence: When prices make lower lows, but the MACD line makes higher highs, it forms a bottom divergence. This indicates that the downward trend of the price has slowed, and the current market believes that the next wave of decline may be a buying opportunity, thus the golden cross following the bottom divergence is seen as a buy/long signal.
Comprehensive judgment combining other factors
Although the MACD indicator has a certain role in seeing through the main force's washing dish scam, it cannot rely solely on MACD for judgment; it also needs to be combined with the following factors:
Trading volume
During the washing dish process, trading volume usually shows a shrinking characteristic. If it is a suppression washing dish, the trading volume will expand when the price falls but will not expand excessively, then quickly shrink; if it is a consolidation washing dish, the trading volume will continue to maintain a low level; if it is a pull-up and drop washing dish, the trading volume will expand during the pull-up and shrink during the drop. When the price enters the main rising wave, the trading volume usually expands significantly.
Price position
If the price is at a relatively low level, the possibility of the main force washing the dish is greater; if the price is already at a high level and some suspicious technical signals appear, then the possibility of the main force unloading needs to be considered seriously.
Market environment
The trend of the market has an important influence on individual coins. If the market is in an upward trend, the probability of washing dishes before the main rising wave is relatively high; if the market is in a downward trend, the main force may take the opportunity to unload.
The MACD indicator is one of the powerful tools for investors in the cryptocurrency market. By studying the performance of MACD under different circumstances, combined with trading volume, price position, and market environment, investors can effectively see through the main force's washing dish scam before the main rising wave and avoid being easily washed out.
Let's encourage each other!