If you really don’t plan to leave the cryptocurrency circle in the next three years and are determined to make it your first career, please remember the following operating experience. You will thank me after reading it!

1. Left side position management
1) Don’t use up all your money at once, buy in batches!!!
2) You can divide the funds into several parts. When you are not sure about the bottom, buying in batches is the most appropriate way to spread the cost price!!!
(3) The bottom-up replenishment should be handled flexibly according to the changes in market conditions. Do not replenish positions too frequently, as this will have a negative impact on the averaging effect of the currency price. The advance of 20%, 30%, and 50% is suitable for aggressive investors who are keen on bottom-fishing!!!
(4) The initial amount of funds entering the market is relatively small, and the price of the purchased currency does not rise but continues to fall. In the future, the position is gradually increased, and the proportion of the increase is getting larger and larger, thereby diluting the cost. This method has a relatively small initial risk. The higher the funnel, the more considerable the profit! !
2. Right side position management
(1) Buy 1: When the 5-day moving average crosses the 10-day moving average, add 30% to your position! !
(2) Buy 2: When the price of the currency effectively breaks through the lifeline, continue to add 30% of the position when it falls back to the lifeline, ensuring that the total position reaches 60% in the initial stage of the upward trend!
(3) Buy 3: Break through the neckline or other important resistance level, and then fall back and stabilize, indicating that the reversal upward pattern is established, and add 20% of the position again. The total position should reach 80%, and the currency should be held for the next move! !
(4) Buy 4: The 5-day moving average and the 10-day moving average cross again above the lifeline, which is a typical signal of accelerating the rise. At this time, the remaining 20% position should also be bought in time to maximize profits!!!
In daily trading, we often come across things like "the top has appeared", "the bottom has been broken", and "entering consolidation". These are actually referring to the K-line combination patterns.
If you want to do technical analysis well, you have to learn the K-line patterns and master them.
In today's article, I will explain all aspects of the K-line pattern, including the use of the K-line pattern, its classification, and the usage of several key K-line patterns. Basically, reading this article is enough for learning the K-line pattern.
The article is full of valuable information written by me carefully. I suggest you collect it and read it. If you gain something from it, you can give the article a like. Thank you.
1. T-shaped line (dragonfly)

Application rules:
A changing line with bullish bottom and bearish top.
2. V-shaped reversal

Application rules:
The bottom is reached and the market reverses and rises.
3. Long upper shadow

Application rules:
1. A long upper shadow appears at the high level of an upward trend. If the trading volume increases, it means that the bulls are actively chasing highs, but the selling pressure at high levels is heavy, and it is difficult for prices to climb upward. The market is likely to turn around and retreat or reverse.
2. A long upper shadow appears at the low point of the downward trend. If the trading volume increases, it means that long positions have intervened to buy at the bottom, but they cannot effectively curb the selling pressure, and the long and short sides have gradually turned to be evenly matched.
4. Long crosshairs

Application rules:
1. The cross line may constitute an important warning signal. The original trend pauses or reverses.
2. Cross lines are only important when they do not appear frequently in a market.
3. If there is a very long upper shadow or a very long lower shadow, it means that the market is hesitant. Compared with ordinary cross lines, it has a better judgment significance of indicating the pause or reversal of the original trend. The bottom is reached and the reversal rises.
5. Long lower shadow

Application rules:
1. A long lower shadow appears at the high level of an upward trend. If the trading volume increases, it means that the selling pressure is increasing and there is enthusiasm for taking over, but there is a sense of exhaustion among the bulls.
2. A long lower shadow appears at the low point of the downward trend. If the trading volume increases, it means that there is panic selling of chips, but there is enthusiastic buying at low levels, and a large number of long bottom-fishing orders are involved.
6. Water Lily

Application rules:
A large bullish candle crosses three moving averages, changing the moving averages to a bullish arrangement, and the trend is bullish.
7. Big Yang Line

Application rules:
1. The appearance of a large positive line in an upward market means that the market is rising sharply.
2. The appearance of a large positive line in a falling market means that the market will rebound sharply upward.
8. Big Yin line

Application rules:
1. The appearance of a large black candlestick in an upward market means that the market will fall back sharply.
2. If a large black candlestick appears in a falling market, it means that the market is falling rapidly.
9. Inverted V-shaped reversal
Application rules:
Reversal pattern, bearish outlook.
10. Inverted Hammer

Application rules:
If the Inverted Hammer appears after a downtrend, it forms a bullish candlestick pattern, just like a normal hammer. When analyzing an Inverted Hammer, it is important to wait for a bullish signal in the next time unit after the Inverted Hammer appears. The confirmation signal of the Inverted Hammer may take the following form: the opening price of the day after the Inverted Hammer gaps up and exceeds the body of the Inverted Hammer. The larger the gap, the stronger the confirmation signal. It may also take another form: the day after the Inverted Hammer is a white candlestick, and its price is at a higher level, completing the bullish confirmation signal.
11. Hanging Line

Application rules:
1. If the hanging man appears after an upward trend, it constitutes a bearish candlestick chart pattern.
2. When analyzing the Hanging Neck Line, one thing is very important: when the Hanging Neck Line appears, you must wait for the bearish signal of the next time unit to verify it. The verification signal of the Hanging Neck Line may take the following form: the larger the downward gap of the opening price of the next day after the Hanging Neck Line, the stronger the verification signal.
3. It may also take another form: if the next day after the hanging line is a black K-line and its closing price is lower than the body of the hanging line, then the bearish verification signal is completed.
12. Stacked Multi-party Cannons

Application rules:
Overlapping multi-party cannons, the future trend is extremely bullish.
13. Stacked empty square cannon

Application rules:
The repetition of the short-side artillery means that there is a high possibility of a short-term downward trend.
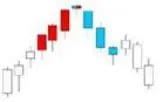
14. Top Cross

Application rules:
The short-term peak has been reached and the outlook is bearish.
15. Dongfanghong Dayangsheng
Application rules:
If the positive lines are continuously drawn and the moving average forms a golden cross, the trend will be bullish.
16. Guillotine

Application rules:
A large black candlestick cuts off three moving averages, changing the arrangement of the moving averages to a bearish arrangement, and the outlook is bearish.
17. Multi-party Cannon

Application rules:
The bulls are strong and the short-term outlook is bullish.
18. Dawn (Counterattack Line)

Application rules:
1. The counterattack line pattern appears in a downward trend from a slow decline to a sharp decline, and the market will evolve into a V-shaped reversal or a sideways trend to stop the decline.
2. The counterattack line pattern is determined by the depth of the subsequent Yang line cutting into the Yin line entity. That is, the deeper the Yang line cuts into the Yin line entity, the higher the possibility that the market will evolve into a reversal or stop falling and sideways trend.
19. Bald Yang Line

Application rules:
The bald bullish candlestick pattern indicates an active upward offensive trend by both parties. The specific strength of the attack depends on the size of the bullish candlestick entity.
20. Bald Yinxian

Application rules:
The bald black candlestick pattern indicates the firm momentum of short selling pressure, and the specific strength depends on the size of the black candlestick entity.
21. Evening Doji
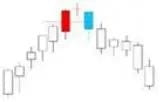
Application rules:
1. The judgment rules for the Evening Doji are the same as those for the Evening Star.
2. The Evening Doji has greater significance for judging a trend pause or reversal than the Evening Star.
22. Evening Star

Application rules:
The key to this pattern lies in the depth to which the black body of the third day penetrates into the white body of the first day.
Here are some factors that can help increase the chances of Evening Star patterns being reversal signals if they have these characteristics. These factors include:
(1) If there is a price gap between the body of the first K-line and the body of the star line, and there is also a price gap between the body of the star line and the body of the third K-line;
(2) If the closing price of the third candlestick falls deeply into the body of the first candlestick (generally more than 50%);
(3) If the trading volume of the first K-line is light, while the trading volume of the third K-line is heavy.
23. Golden Spider

Application rules:
The long, medium and short-term moving averages are golden crosses, and the outlook is bullish.
24. Nine Yin White Claw

Application rules:
The appearance of continuous negative lines and moving average death crosses indicates that the trend in the later period will be disastrous.
25. Dramatic rise and red

Application rules:
Sharp rise and side-by-side red (parallel positive lines) - also known as "parallel positive K-line, two positive lines with gap and flat bottom".
This pattern is composed of two adjacent white candlesticks with the same opening price. Their bodies are also almost the same height.
During an uptrend, a set of parallel white candlesticks that gap up form a bullish continuation pattern.
Let me share with you a set of practical strategies that I have used over the years. The average winning rate is 80%, which is a rare achievement in the cryptocurrency trading community.
Without further ado, let’s get straight to the point!
In 2 years, I have made a brilliant achievement of more than 10 million from 3,000 yuan step by step, relying on this set (K-line pattern and MACD).
Read this article carefully and you will benefit for life!
Market Implications
1. The meaning of double moving average market
1. Location meaning
The double lines above the 0 axis represent a bullish trend, while those below the 0 axis represent a bearish trend;
The double lines crossing above or below the 0 axis are used as the basis for judging the current market trend.

2. Double line crossing
There are too many signals of cross death cross appearing in small cycles, so it is best not to use them alone.

2. Market meaning of volume column
Long-Short Watershed: The 0 axis is the long-short watershed, above the 0 axis, the market tends to be long, and below the 0 axis, the market tends to be short;
Bullish trend: The volume column on the 0 axis changes from small to large, which is a bullish trend, and the market shows an upward trend;
Bullish callback: The volume column on the 0 axis gradually shrinks from large to small, which is a bullish callback, and the market shows an upward trend adjustment;
Short position follows the trend: the volume column under the 0 axis changes from small to large, which is a bearish trend, and the market shows a downward trend;
Bearish rebound: the lower volume column under the 0 axis changes from large to small, which is a bearish rebound, and the market shows a downward trend adjustment.

Comprehensive meaning
1. Balance of long and short positions
The moving average circles around the 0 axis, and the volume bars are distributed in sporadic small quantities. At this time, the market is likely to show volatility.

2. Divergence
Divergence is a signal of kinetic energy exhaustion. An effective divergence refers to the simultaneous divergence of the double lines and the volume column.

3. Trend Continuation
The trend is rising + the volume column is always above the 0 axis, indicating that the upward trend continues; the trend is falling + the volume column is always below the 0 axis, indicating that the downward trend continues.

8 entry points of “MACD”
1. The first and second types of buying and selling points in the Chaos Theory
The first buying point
Trading principles:
Bottom divergence + golden cross as a buying point;
Top divergence + death cross is used as a selling point.

Second buying point
Trading principles:
The double lines run above the 0 axis for the first time;
The first callback double line is pulled to near the 0 axis;
Afterwards, buy when a golden cross is formed above the 0 axis.

2. Trend Judgment Trading Method
Trading principles:
Determine the trend based on the big cycle;
Enter the market in a small cycle.


From the analysis of weekly and daily lines, the long cycle is bullish, and the daily line has a short-term correction. Our trading strategy is that if you short the daily line, you can only do a correction, or wait until the daily line is weak and then go long along the weekly line.
We can find entry points in small cycles, such as 1 hour or 4 hours.

3. Energy column position trading method
Trading principles:
The moving average circles around the 0 axis;
The volume bars are distributed in sporadic small volume bars;
At the same time, enter the market when the price breaks through.
The MACD indicator volume column is shrinking, and the moving average is coiled near the 0 axis, indicating that the bulls and bears are in a state of equal strength, which is consistent with the consolidation and oscillation of the K-line, and is a form of energy accumulation.
Therefore, when the shape of the MACD indicator volume column is consistent with the classic shape of the K-line, such as triangle, flag and other narrow consolidation market trends, once the narrow fluctuation shape is broken, it is often a good opportunity.

4. Key Position Trading Method
Trading principles:
Key support and resistance levels;
The K-line shows a needle signal;
When the volume column changes from positive to negative, go short;
The volume bar changes from negative to positive, so go long.

5. Secondary red-green trading method (air refueling signal)
Trading principles:
The first wave of rising volume should not be too large or too small. Corresponding to the K-line price pattern, it is best to be in an attacking pattern.
The first wave of positive volume columns gradually expanded and then gradually shrunk, but when it shrunk to a certain extent, there was no negative volume column. Instead, the positive volume column expanded again and continued to gradually expand.

6. Buddha’s hand upward
Trading principles:
After the double-line golden cross, it moves upward as the commodity price goes up, and then the price pulls back;
After the double lines return to near the 0 axis, the DIF line immediately turns upward, forming an upward Buddha's hand shape.

7. Main rising wave trading method
Trading principles of falling main rising waves:
The MACD volume column has been above the 0 axis, and the price has continued to rise;
The MACD volume bar is below the 0 axis for the first time, and the price has a 1st wave callback;
The volume bar of wave 2 is smaller than the volume bar of wave 1;
When wave 2 pulls back and the MACD volume column shortens or expands twice, enter the market to short trade wave 3.

The same applies to the main upward wave.
8. Divergence + Pattern Trading Method
Trading principles:
MACD diverges;
Trend broken.

Divergence does not mean a reversal, it can also be a sign of recovery. After a divergence, there will be another divergence, so it is easy to be deceived when we use divergence to exit or enter the market.
But we can use price trends to determine market turning points.
Cryptocurrency trading advice:
First, don’t hold on to a position. The profits you make from holding on will sooner or later be returned to the market because of “holding on”.
Second, don’t guess the top or bottom. The profits from guessing will sooner or later be returned to the market because of “guessing”.
Third, don’t guess the top or bottom, because it may still be halfway up the mountain.
Fourth, don’t rely heavily on news, because that is just “guessing” the top and bottom.
Fifth, don’t leave the market easily when you are profitable, because you may be halfway up the mountain.
Sixth, don’t get excited when you see big negative or positive lines, because they may be a “performance” by the market makers for the investors.
Seventh, don’t think that the market you see is the last wave and rush into it recklessly; as long as your principal is still there, there will be markets every day.
Eighth, do not trade frequently. Not only will it make you lose your direction and increase the chance of making mistakes, it will also increase transaction costs, which will not be worth the cost.
Ninth, don’t make orders against the trend. If you are right, hold on to it. If you are wrong, run away quickly.
Tenth, don’t buy at a low price, and don’t sell at a high price. Don’t act rashly until the trend changes.
$HMSTR $GPS #币安HODLer空投HOME #美国加征关税

