1. What is a Candlestick?
Candlestick, also known as 'Candle Chart', don’t be fooled by its appearance resembling a small sausage, it is actually the 'prophet' of the crypto world!
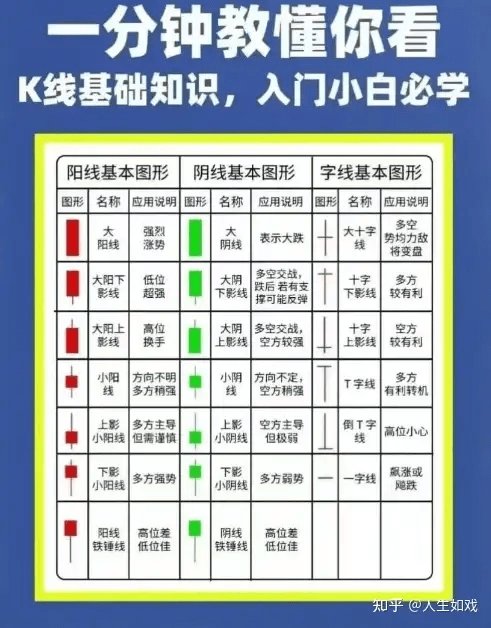
In simple terms, a candlestick depicts the price fluctuations over a period of time (for example, 1 hour, 1 day) using a 'candle'. Its four key data points: Open price, Close price, Highest price, Lowest price.
Body: The body of the candle, color divided into two types:
Red (Bullish Candlestick): Close price > Open price → Price has risen!
Green (Bearish Candlestick): Close price < Open price → Price has fallen!
Shadow: The 'little braid' that extends from the candle up and down
Upper shadow: Distance from the highest price to the body → The 'ceiling' where bulls and bears fight.
Lower shadow: Distance from the lowest price to the body → The 'floor' where bulls and bears fight.
For example:
If there is a long red bullish candlestick, it indicates that buyers are too strong, directly smashing the price from the floor to the ceiling!
If there is a long green bearish candlestick, it indicates that sellers are fierce, kicking the price from the peak into the pit!
2. What secrets are hidden in the body parts of a candlestick?
1. Length of the body:
Bullish Candlestick: Thick body → Buyers are frantically buying, the trend may continue to rise!
Bearish Candlestick: Thick body → Sellers are frantically selling, the trend may continue to fall!
Small bullish/small bearish: Thin body → Bulls and bears are evenly matched, the market may fluctuate!
2. Length of the shadow:
Long upper shadow: After rising halfway, it gets smashed down → May be a 'guiding hand', or may be a top signal!
Long lower shadow: Pull back after falling halfway → May be a 'golden pit', or may be a precursor to a rebound!

Mnemonic:
The longer the shadow, the more twisted the bulls and bears! The longer the body, the clearer the trend!
3. Common candlestick patterns, understand market sentiment in seconds!
1. Doji:
Extremely small body, upper and lower shadows are about the same length → Bulls and bears are even, the market is about to change!
Appearance position:
After a lot of rises → May be at the top!
After a lot of drops → May be at the bottom!
2. Hammer:
Long lower shadow, small body → After falling to the floor, someone buys the dip → May reverse! (Suitable for dip buyers!)
3. Hanging Man:
Long lower shadow, but appears after continuous rises → Beware of the main force raising the price to unload! (Run away!)
4. Red Three Soldiers:
Three consecutive small bullish candlesticks → Trend is steadily upward → Keep up!
5. Black Three Crows:
Three consecutive small bearish candlesticks → Trend downward → Stay away!
4. Practical tips, even beginners can use!
1. Look at the volume:
Big candlestick rise + Volume surge → True breakthrough, just do it!
Big candlestick rise + Volume decrease → Raise the price to unload, run away!
2. Identify key levels:
Support level: Repeatedly falling to a certain position and bouncing back → May be a good buying opportunity!
Resistance level: Repeatedly rising to a certain position and getting smashed down → May be at the top!
3. Don't be greedy:
Do not guess a single candlestick randomly, look at combinations of three or more! For example, 'Morning Star' (fall → small star → rise) is a reversal signal, but a single small star is useless!
5. Summary
Summary: Candlesticks are the 'ECG' of the crypto world, understanding the body, shadow, and patterns can help predict rises and falls! Don’t blindly trust a single candlestick, combine with volume and key levels for a higher win rate!


Which candlestick has tricked you before? Share your story in the comments! Finally, I wish all crypto friends can ride the waves in the crypto world!