🚀 Bitcoin ($BTC ) Price Analysis – Is a Breakout on the Horizon?
#Bitcoin #BTCUpdate #CryptoAnalysis #BTCChart #TechnicalAnalysis #BinanceFeed #BullishBreakout #BTCTraders #CryptoIndia
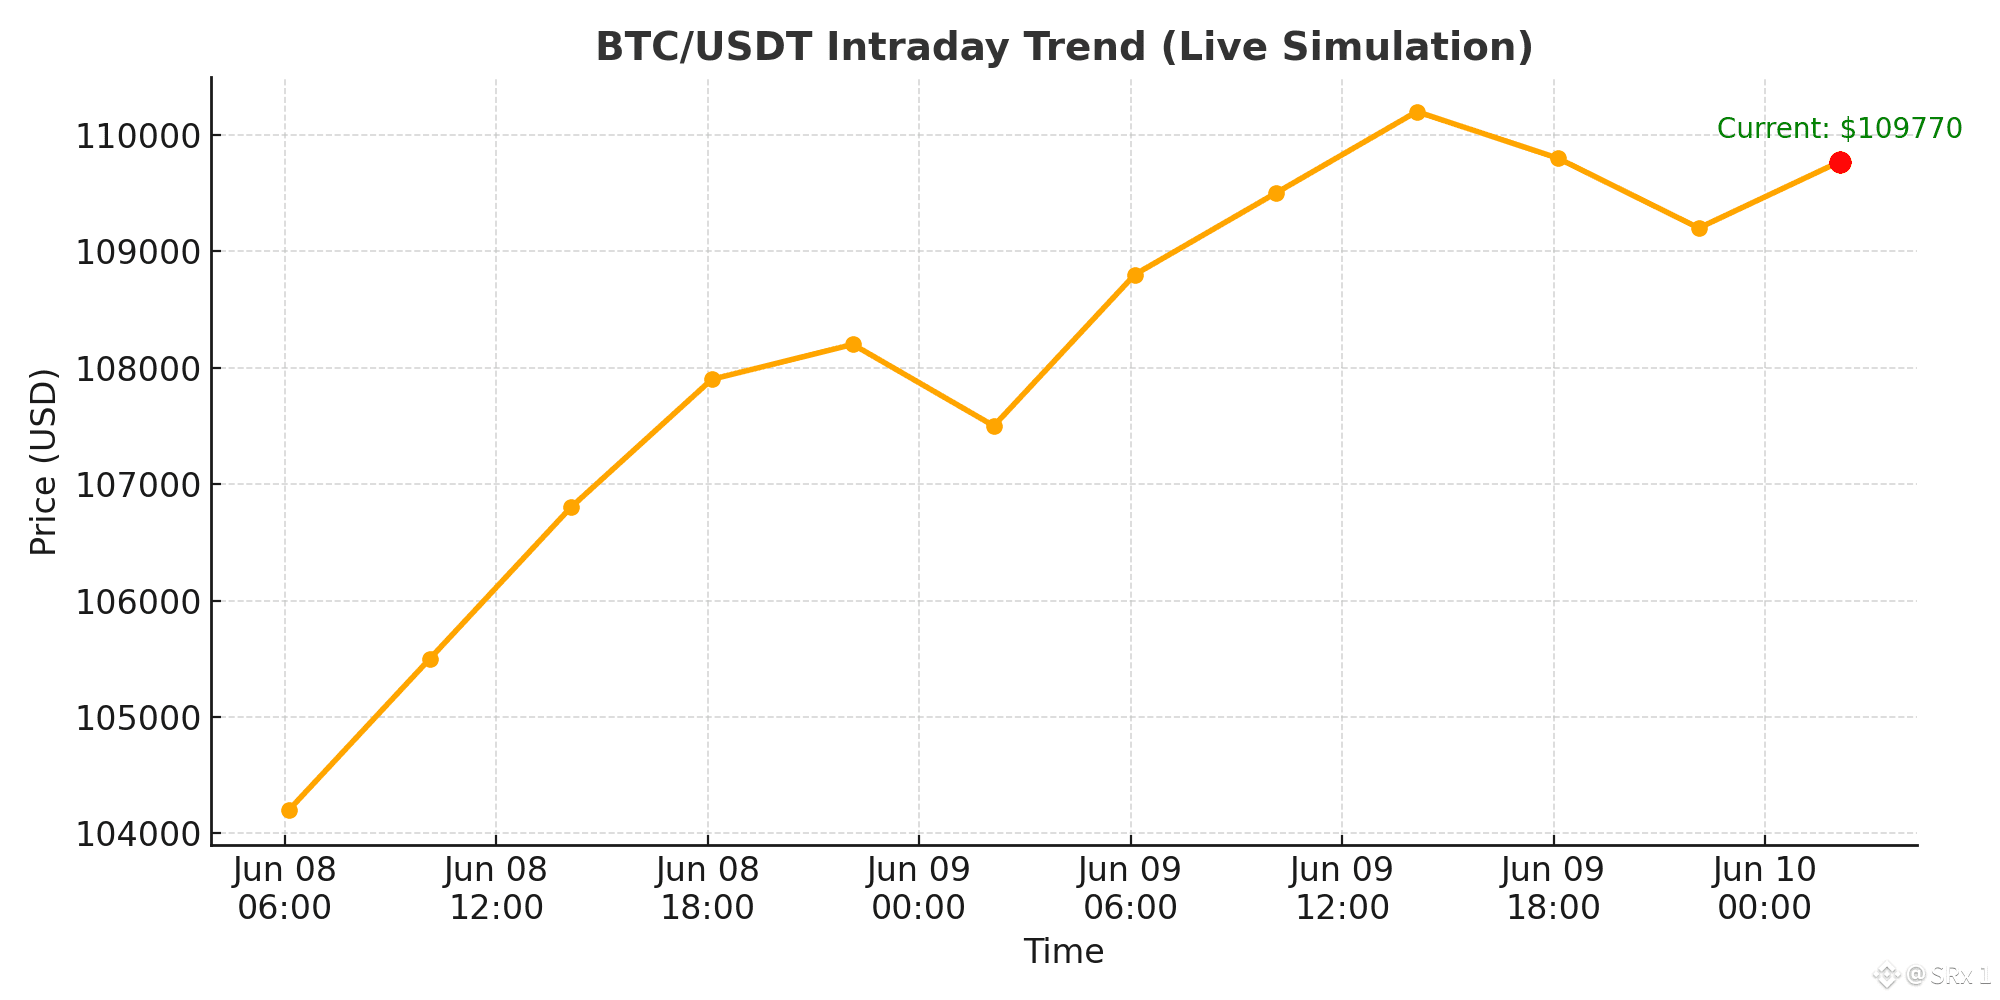
Bitcoin is currently showing strong bullish momentum as it consolidates around $109,770 after a series of higher highs in the past few sessions. The intraday chart indicates that BTC is preparing for a major move — possibly a breakout — as it continues to respect its support levels.
📊 Chart Summary:
Recent High: $110,200
Current Price: ~$109,770
Support Level: $108,000
Resistance Level: $110,500
Bitcoin formed a bullish flag pattern, with a potential breakout zone above $110,500. If the price closes above this resistance on good volume, we could see an extended rally up to $112,000–$115,000 in the short term.
---
🔎 Technical Insights:
The RSI is holding between 60–65, indicating continued bullish strength but still with room for further gains.
The MACD is in positive territory, suggesting momentum is on the buyer's side.
Candlestick structure on the 4H chart shows solid base-building near the $109,000 mark — a key level of defense.
🧠 Strategy Suggestion:
Entry Zone: $109,500 – $110,000
Stop Loss: $107,900
Target 1: $112,000
Target 2: $114,500
This setup suits short-term swing traders, but scalpers can also look for quick moves between small range zones.
📝 Conclusion:
Bitcoin is currently in a healthy consolidation phase. A breakout above $110,500 can trigger the next leg of the rally. Keep an eye on volume and breakout confirmation before entering heavy positions.
> 🚨 This article is for informational and educational purposes only. Not financial advice. Always do your own research (DYOR
