How much patience do top traders have? My mentor, when I first entered the crypto space, spent 80% of the time waiting and 20% executing trades. Now he lives comfortably, fishing, playing golf, and only catches a few waves of market movements each year.
I still clearly remember my mentor's sentiment that day: life is sometimes so wonderful, when you try your best, you may not get it, but after truly letting go, you may end up with results.
My mentor back then was also an old retail trader, adept at chasing highs and cutting losses. After suffering heavy losses in his account, he temporarily exited the crypto space, but later picked it back up and unexpectedly turned things around. I have summarized some of the sixteen key elements from this, sharing them with everyone.
1. Choose altcoins in a bull market, buy BTC in a bear market; this is my secret recipe!
2. Coins with increased volume at the bottom must be closely monitored; this is a signal for a breakout, don’t miss it!
3. For coins in an uptrend, when they pull back to important moving averages, this is the best time to buy. Remember to seize the opportunity!
4. Do not trade frequently; making a few big trends correctly in a year is enough; greed can lead to significant losses!
5. You must control your position well; never go all in, give yourself some leeway, so you can respond to market changes!
6. For losing junk coins, do not average down; timely stop-loss is the wise choice; don’t let yourself get deeper into trouble!
7. News can only serve as a reference; don’t blindly follow trends, or the consequences will be yours to bear!
8. Do not touch unfamiliar coins; focus on the fields you are familiar with so you can win steadily!
9. Do not be influenced by market emotions; remain calm and rational to make correct decisions!
10. When altcoins rise too much, they will definitely fall; when they fall, they may not necessarily rise. Choosing wisely is important, so keep your eyes open!
11. When most people are optimistic, it is often when risks arise. Remember this and don’t let yourself become a bag holder!
12. Learn to stay in cash, waiting for the market to give clear signals before entering, to avoid unnecessary losses!
13. Avoid following the hype; hypes often come and go quickly, and don’t let yourself be trapped!
14. You must have your own trading system and strictly implement it to maintain stable profits!
15. Investing is a long race; maintaining a good mindset will allow you to laugh until the end. Don’t let yourself give up halfway!
16. Investing does not necessarily mean making money; it is highly likely to lose money. Therefore, try to use spare money for investment. When you invest with spare money, your mindset will be better, and the probability of winning will increase. Remember this and don’t let yourself fall into trouble because of investments!
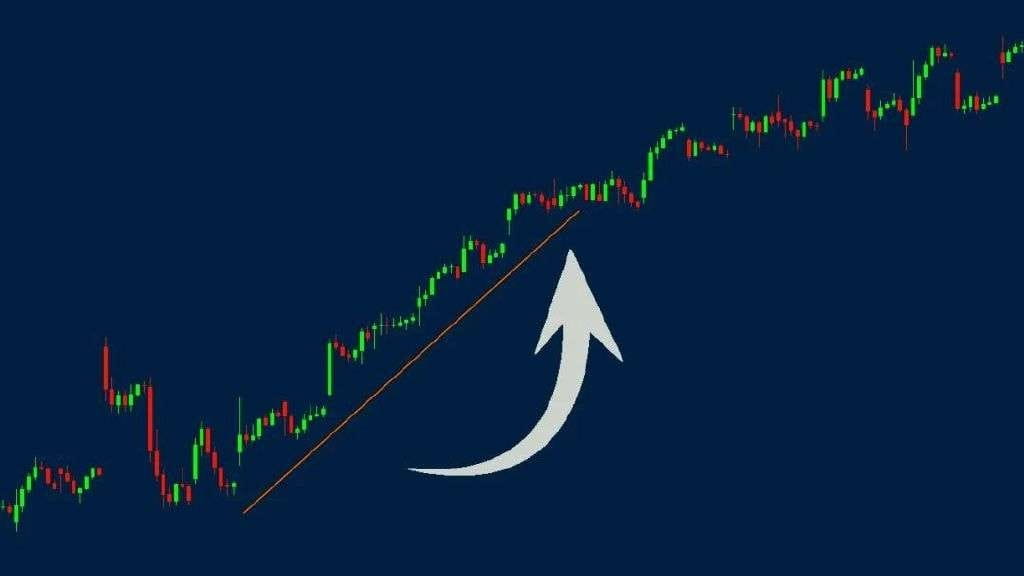
Only buy this type of trend for a lifetime, going from huge losses to huge profits!
I have practiced this method in over ten thousand trades, with a win rate of up to 98%! Last month, in March, I earned 120,000 US dollars in just one month!
There are two types of engulfing patterns: bullish and bearish.
The engulfing candlestick pattern consists of two candlesticks, so it belongs to the category of double K patterns.
The structure of this pattern is very easy to identify. On the chart, the first candlestick is completely engulfed by the next candlestick. Remember, to form an effective engulfing pattern, the body of the first candlestick should be completely contained within the body of the next candlestick. Please see the example of the engulfing pattern in the chart below:
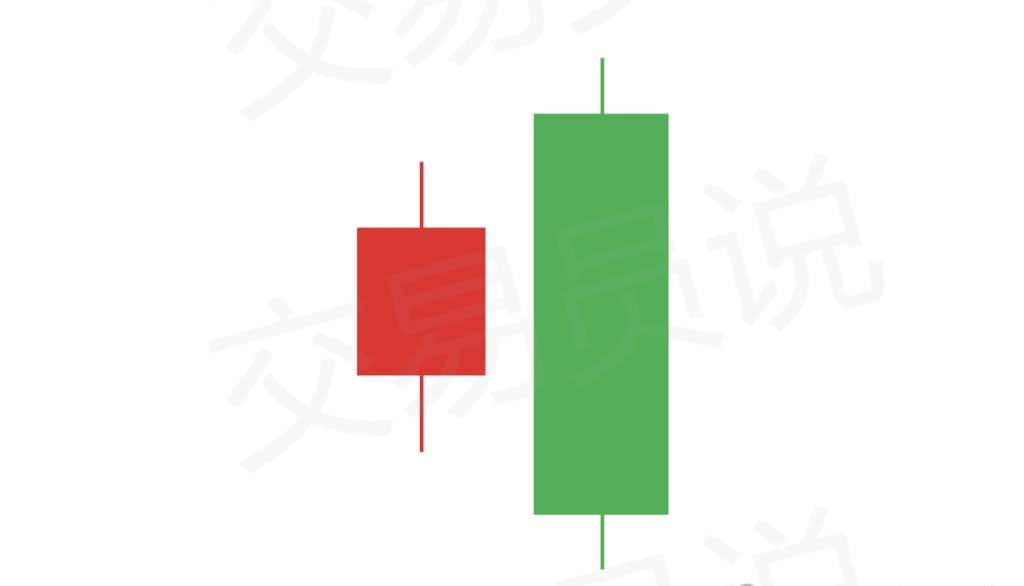
This is how the engulfing pattern manifests on the chart. As mentioned above, the first bearish candlestick (red) is completely engulfed by the next bullish candlestick (green). Similarly, the reverse scenario is also possible. The engulfed candlestick can be bullish, while the engulfing candlestick can be bearish.
Potential of the engulfing candlestick pattern
The engulfing candlestick pattern has a strong reversal signal. If an engulfing pattern forms during a price increase, it sends us a signal indicating that a top may be forming.
Conversely, if an engulfing pattern appears during a downtrend, it indicates that the price trend may be forming a bottom.
Types of engulfing patterns
As mentioned earlier, there are two types of engulfing patterns: the first is the bullish engulfing pattern, and the other is the bearish engulfing pattern. Now let’s understand these two engulfing patterns separately:
Bullish Engulfing
Bullish engulfing patterns typically appear in bearish trends. It starts with a bearish candlestick on the chart, followed by a bullish candlestick that completely engulfs the first candlestick. This pattern creates bullish potential on the chart, possibly reversing the current bearish trend. Please see the bullish engulfing candlestick pattern in the chart below:
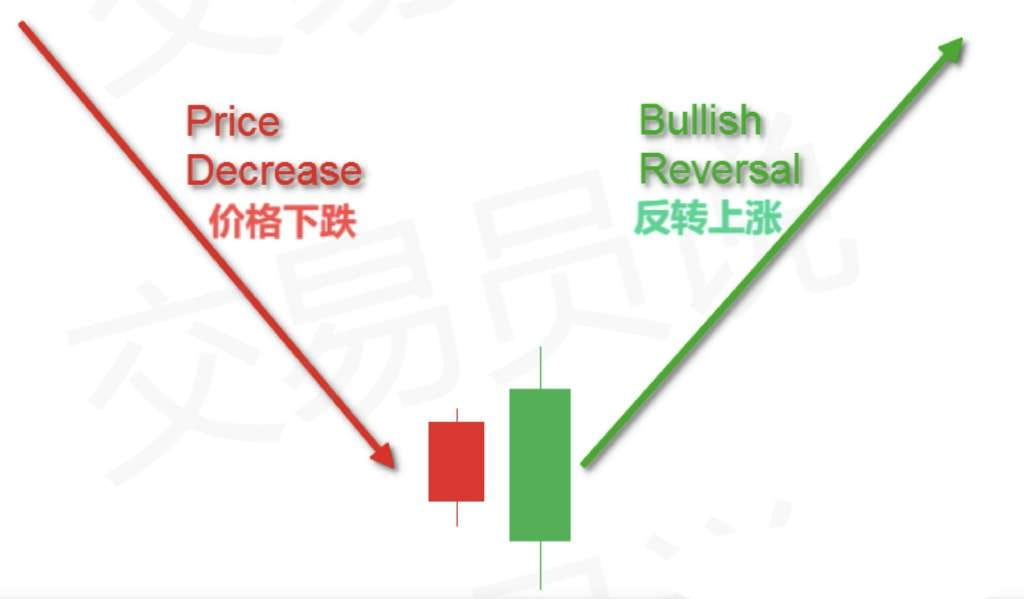
Notice that the first candlestick in the pattern is bearish, and it is completely contained within the body of the next bullish candlestick. This forms a bullish engulfing pattern, suggesting a trend reversal. An effective bullish engulfing pattern indicates that after a recent decline, a bullish trend may begin.
Bearish Engulfing
The functions of the bearish engulfing pattern are exactly the opposite of the bullish engulfing pattern. The bearish engulfing pattern typically appears in a bullish trend. The pattern starts with a bullish candlestick, which is then completely engulfed by the next bearish candlestick. This pattern creates strong price reversal potential, indicating that the current bullish trend may turn into a new bearish trend. Now please see the bearish engulfing pattern in the chart below:
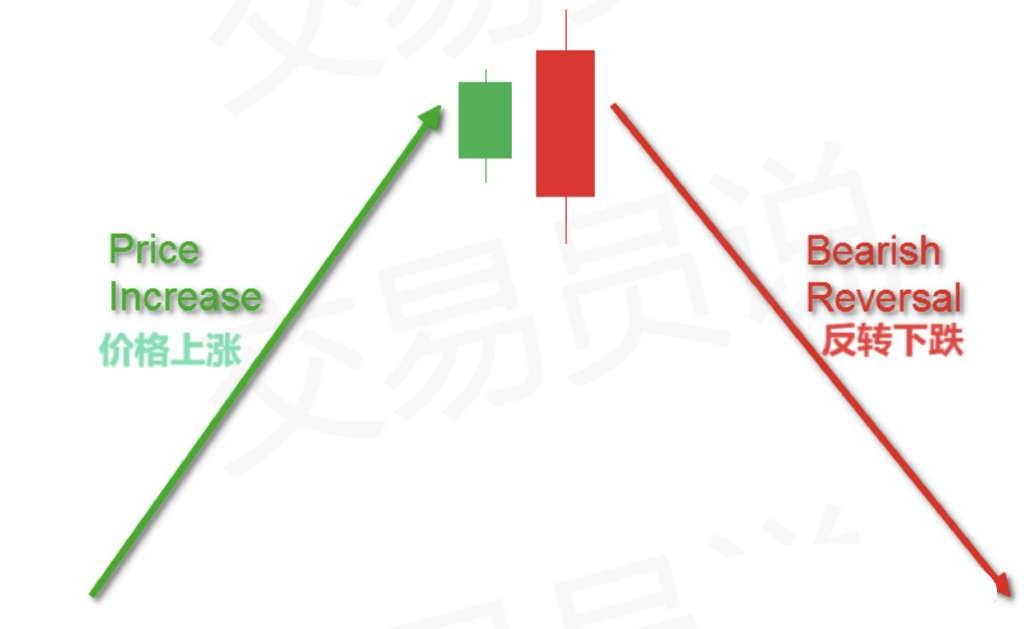
In the chart above, the engulfed candlestick is bullish (green), while the engulfing candlestick is bearish (red). The body of the second candlestick completely contains the first candlestick, completing the bearish engulfing pattern on the chart. The bearish engulfing pattern may indicate that a new downward trend will begin on the chart.
Confirmation of the engulfing pattern
Confirmation of the engulfing pattern appears on the candlestick following the pattern. It needs to break through the level of the engulfing candlestick's body to confirm the validity of the pattern.
An effective bullish engulfing pattern will be followed by a third candlestick (bullish), which should break above the body of the engulfing candlestick. An effective bearish engulfing pattern will be followed by a third candlestick (bearish), which should break below the body of the engulfing candlestick. As shown in the chart below, this demonstrates the confirmation of the engulfing pattern on the chart:
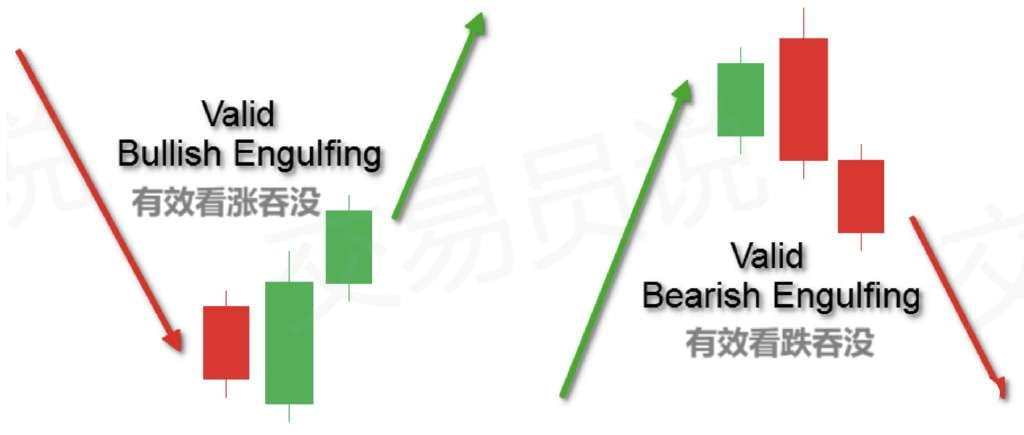
Please note that this time we saw a confirmation candlestick after the pattern. When you see this candlestick behavior after the engulfing pattern, it will confirm the validity of the pattern.
Engulfing pattern trading strategy
We have discussed the structure of the engulfing pattern in detail. Now let's discuss the trading strategies related to this chart pattern.
Entry for engulfing pattern trades
The entry point for trades is usually when the engulfing pattern is confirmed. This is the third candlestick (the one following the engulfing candlestick), which should break the body of the engulfing candlestick and move in the expected direction. When the candlestick closes beyond this level, we confirm the pattern and can open the corresponding trade.
If the engulfing pattern is bearish, the price breakout should go below the body of the engulfing candlestick. In this case, we should prepare to short. If the engulfing pattern is bullish, the price breakout should go above the body of the engulfing candlestick. This means we should go long.
Stop-loss settings for the engulfing pattern
Without a doubt, controlling risk should be your top consideration in trading. Therefore, your engulfing trades must have stop-losses set.
The best stop-loss position in engulfing trades is set outside the limits of the engulfing pattern. If the engulfing pattern is bullish, the stop-loss should be set below the lower shadow of the engulfing candlestick. If the engulfing pattern is bearish, the stop-loss should be set above the upper shadow of the engulfing candlestick.
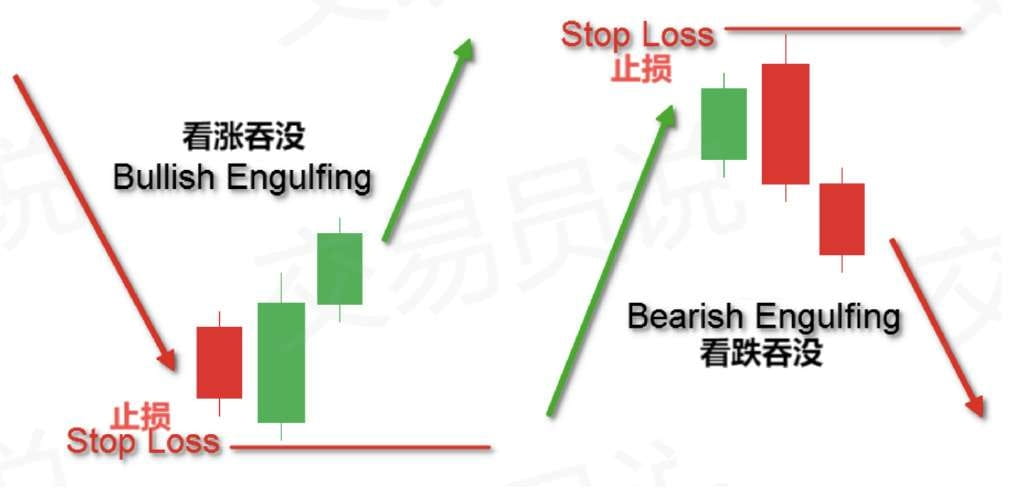
The chart above shows how to set stop-losses when trading bullish and bearish engulfing patterns. If the price fails to move in the expected direction and triggers the stop-loss, this will prove the trade assumption to be incorrect while protecting your funds from minimal losses.
Take-profit settings for the engulfing pattern
A rule of thumb is that engulfing trades should be held until the price movement equals the size of the pattern. This means the minimum take-profit target pursued from the engulfing pattern should equal the distance between the upper and lower shadows of the engulfing candlestick.
When the price movement reaches this distance, you can choose to close all or part of your position. If you choose to continue holding part of your position, you need to carefully observe the price movement to look for potential exit opportunities. This includes support/resistance breaks as well as trend or channel breaks. Charts and candlestick patterns are also very important in this regard. If you find chart/candlestick patterns that contradict your current trade, you may need to close your position.
Engulfing pattern with price action strategy
Now let’s illustrate price action-based trading strategies using the engulfing pattern. Please see the chart below:
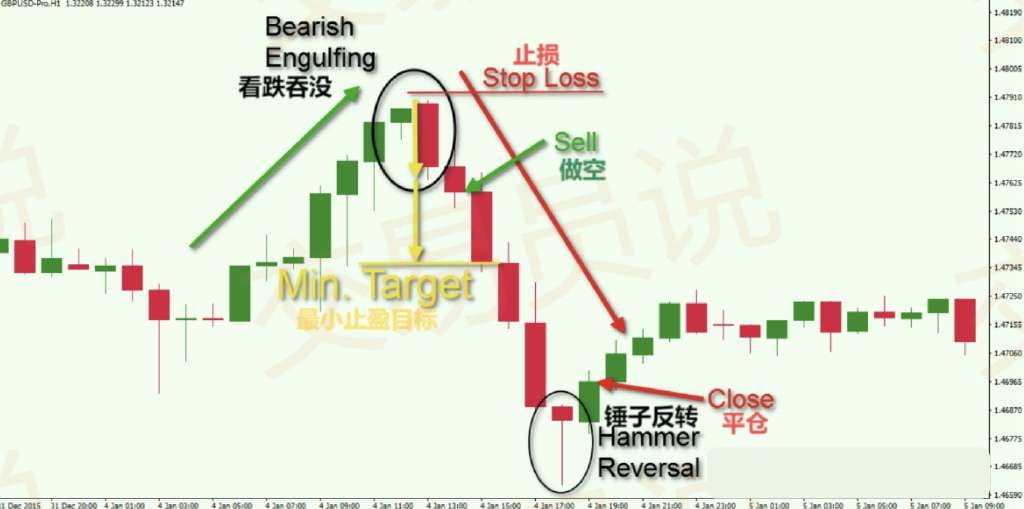
The above chart shows the hourly chart of GBP/USD (British Pound/US Dollar) from January 1 to January 5, 2016. It depicts a bearish engulfing pattern and its trading rules.
The chart starts with a price increase, marked by the green arrow. You will notice that the price movement only forms bullish candlesticks. Suddenly, we see a relatively large bearish candlestick that completely engulfs the previous candlestick. This confirms the presence of a bearish engulfing pattern on the chart.
However, in this case, we need the confirmation candlestick to appear before we can consider building a position. The next candlestick on the chart is again bearish, closing below the body of the engulfing candlestick. This is the confirmation required for trading based on the bearish engulfing pattern. The stop-loss for this trade should be set above the upper shadow of the engulfing candlestick, as shown in the chart above.
The yellow arrows in the chart indicate the size of the pattern and how to apply the minimum take-profit target on the chart. This target is achieved in the next candlestick that appears after the engulfing confirmation.
This trade can be extended to gain more profits. You can use price action rules to determine the final exit signal. You will notice that the GBP/USD price forms two large bearish candlesticks on the chart, which would double the trading profit. However, the next candlestick on the chart is a hammer reversal pattern, also known as a Pin Bar, which has strong bullish potential. When the hammer pattern is confirmed, the trade should be closed. As you can see, the next candlestick is bullish and breaks above the level of the hammer pattern. This confirms the validity of the hammer reversal, generating an exit signal to close the short position. The bearish engulfing trade should be closed at the closing of the bullish candlestick after the hammer pattern, as indicated by the second red arrow in the chart above.
This example demonstrates how price action rules help find the most appropriate exit points on the chart.
Engulfing pattern with support and resistance
Another effective method of trading engulfing patterns with price action is to identify the pattern at key support and resistance levels.
If the price approaches a resistance zone while a bearish engulfing pattern appears on the chart, this creates very strong bearish potential. Conversely, if the price approaches a support level while a bullish engulfing pattern appears, this creates very strong bullish potential.
These situations provide a high probability of success for trading. Many times, when you enter at the right time and in cases of technical convergence, you can enter emerging trend reversals early. Now let’s see how to combine the engulfing pattern with support and resistance levels:
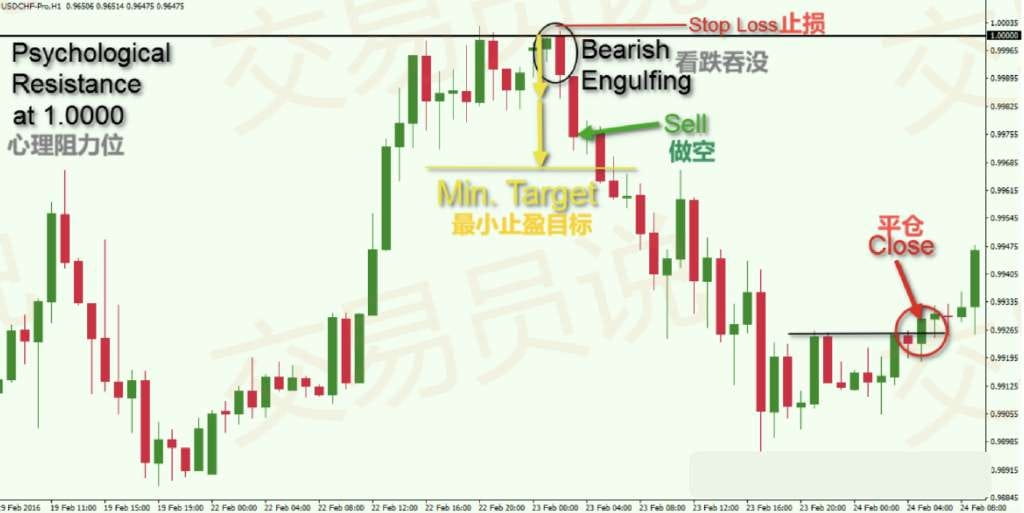
The above chart shows the hourly chart of USD/CHF (US Dollar/Swiss Franc) from February 19 to February 24, 2016. The chart shows another bearish engulfing trade that occurred after the price met the psychological resistance level.
The black horizontal line in the chart indicates the very strong psychological resistance level of the USD/CHF at the parity rate of 1.0000. After a strong price increase, USD/CHF encountered this resistance and subsequently tested it twice more. On the third test of this resistance, the price formed a relatively large bearish candlestick, engulfing the previous bullish candlestick. This formed a bearish engulfing pattern on the chart.
The confirmation of a bearish engulfing appears on the next candlestick, which is bearish and breaks below the body of the engulfing candlestick. The closing of the confirmation candlestick provides a bearish entry signal.
The stop-loss should be set above the upper shadow of the engulfing candlestick, i.e., slightly above the 1.0000 level.
After that, the price began to decline. Subsequently, the minimum take-profit target of the pattern was achieved (as indicated by the yellow arrow). You can close part of the position here and retain some for the price to further decline.
Notice that USD/CHF continues to form lower highs and lower lows during the decline, providing confidence for the downtrend. Suddenly, the price movement begins to consolidate, and we mark the upper limit of the range with a thin black horizontal line. Once the price breaks this resistance and closes above it, the trade should be closed immediately. As you can see, this forms a higher top on the chart, meaning the bearish trend may be interrupted.
Combining support and resistance levels with engulfing patterns is a very excellent price action-based trading method.
Let’s look at another example of a bullish engulfing pattern in EUR/USD: As you can see, the bullish engulfing candlestick pattern exists, indicating a potential buying opportunity.
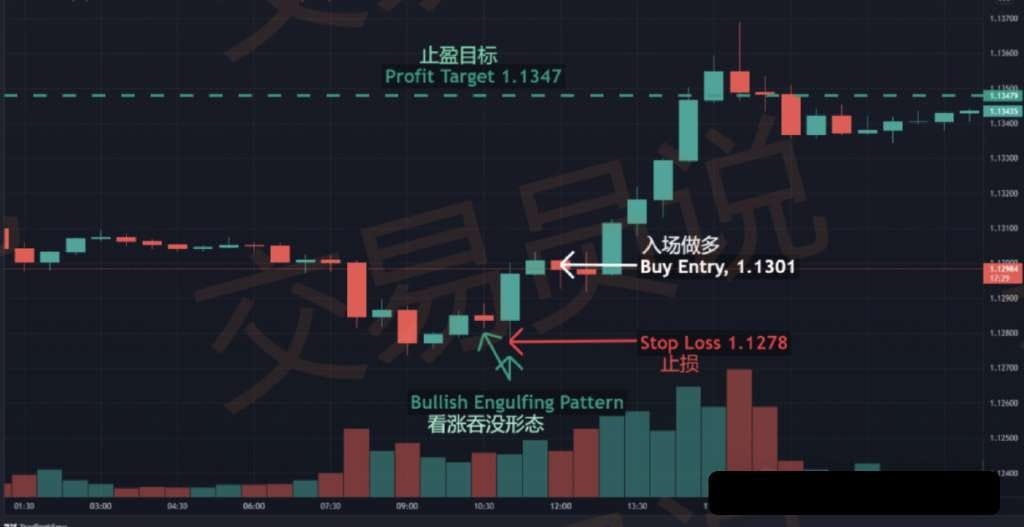
The above trade is executed through the following steps:
1. Identify the bullish engulfing pattern.
2. Execute a buy at the price level of 1.1301 after confirming the pattern.
3. Set the profit target at 1.1347 based on a risk-reward ratio of 1:2.
4. The stop-loss is set at 1.1278, below the lower shadow of the second bullish candlestick.
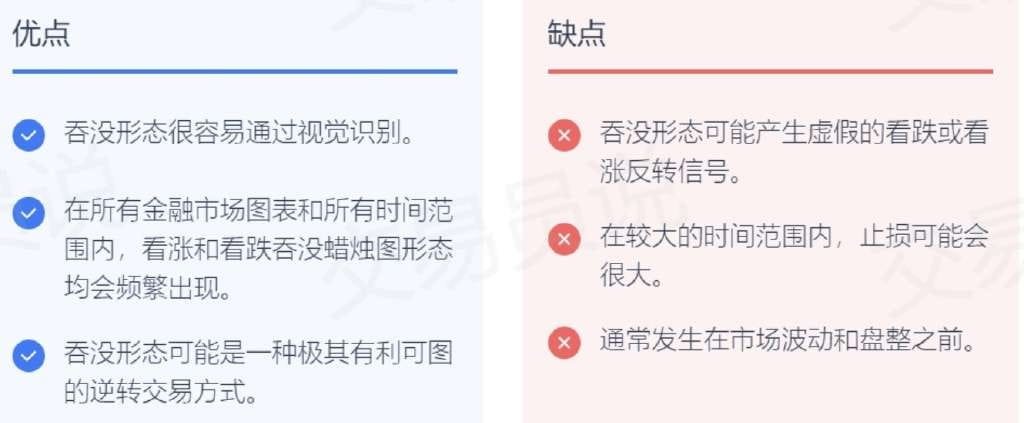
Engulfing candlestick pattern: Advantages and disadvantages
Bullish and bearish engulfing candlestick patterns each have their own advantages and disadvantages, as shown in the chart below:
Summary
The engulfing candlestick pattern is a double K pattern. It consists of two candlesticks, where the second candlestick completely engulfs the previous candlestick, including the shadows. The engulfing candlestick pattern has strong reversal potential. We identify two types of engulfing candlestick patterns:
◎ Bearish engulfing: can be found at the end of an uptrend. It starts with a bullish candlestick, followed by a larger bearish candlestick that completely engulfs the first candlestick in the pattern. This creates bearish (reversal) potential on the chart.
◎ Bullish engulfing: can be found at the end of a downtrend. It starts with a bearish candlestick and is followed by a larger bullish candlestick that completely engulfs the first candlestick in the pattern. This creates bullish (reversal) potential on the chart.
The confirmation of the engulfing pattern appears on the next candlestick on the chart:
◎ If the engulfing pattern is bullish, the next candlestick should be bullish, and its closing price should be above the upper part of the engulfing candlestick's body.
◎ If the engulfing pattern is bearish, the next candlestick should be bearish, and its closing price should be below the body of the engulfing candlestick.
Here are three basic rules for engulfing trades:
◎ Open trades when the price confirms the candlestick closure.
◎ Set the stop-loss order outside the opposing side of the engulfing pattern.
◎ Maintain that the minimum price movement in a trade equals the size of the engulfing pattern, or use price action rules to extend the trading duration.
A high-probability price action method for trading bullish and bearish engulfing patterns is to look for the pattern at significant support and resistance levels.
It took five years to grow from 50,000 to over 36 million, undergoing thousands of days and nights of reviewing and charting over 800 times, summarizing the secrets to making money in the crypto space: (trend trading)
Today, I selflessly share this with everyone; the method is very simple and practical, and beginners can immediately get started. I suggest you directly follow and save it.
Trend trading refers to the trading style of going with the trend when the price is strongly rising or falling. Different traders may have varying definitions of trends.
For instance, a trader who prefers high volatility assets may only consider an asset to be in an uptrend once the price has risen by 20% or more.
A low-volatility trader may only need small price fluctuations to consider that a trend has formed.
Regardless of the time frame or strategy, the goal of trend trading is to identify trends and find ways to join the trend with the lowest risk. To this end, this article will discuss several trend trading strategies and reveal how to find assets that are in an uptrend.
First, let’s talk about how to discover trends.
Trend trading indicators
In trading, the less subjective your view of the market, the better. Therefore, you can use technical indicators to judge market trends.
Trend line
Trend lines are a good way to clearly define market trends. Although there is still a degree of subjectivity, as you need to identify the starting and ending points of the trend line, with some practice, you should be able to identify key support and resistance points and thus clarify the trend.
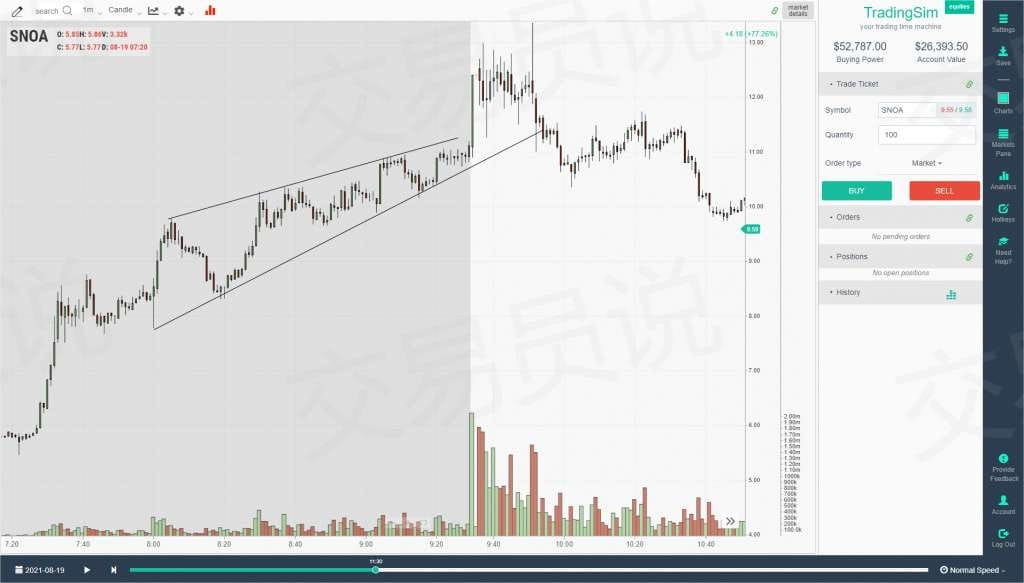
For a bullish trend, you need to connect the lows and highs to form an ascending channel. After all, a bullish trend can only be confirmed when you have a series of higher lows (HL) and higher highs (HH).
When the market is in an upward track, the price should not break below previous lows.
Similarly, for a bearish trend, you only need to reverse the lows and highs.
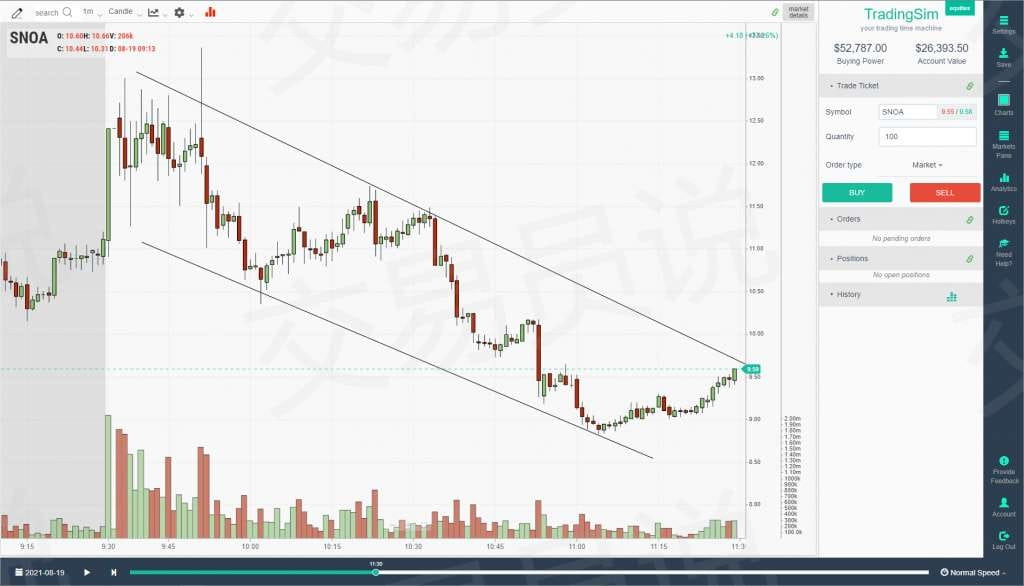
Please note that the two charts above are actually the same stock, only on a reverse trend during intraday trading. Trends can help reveal the direction of your trades. The advantage of trend lines is that as you continue to draw trend lines, your eyes will gradually become sharper, allowing you to predict the direction of stock movements.
This helps set targets and reversal points in your trading process.
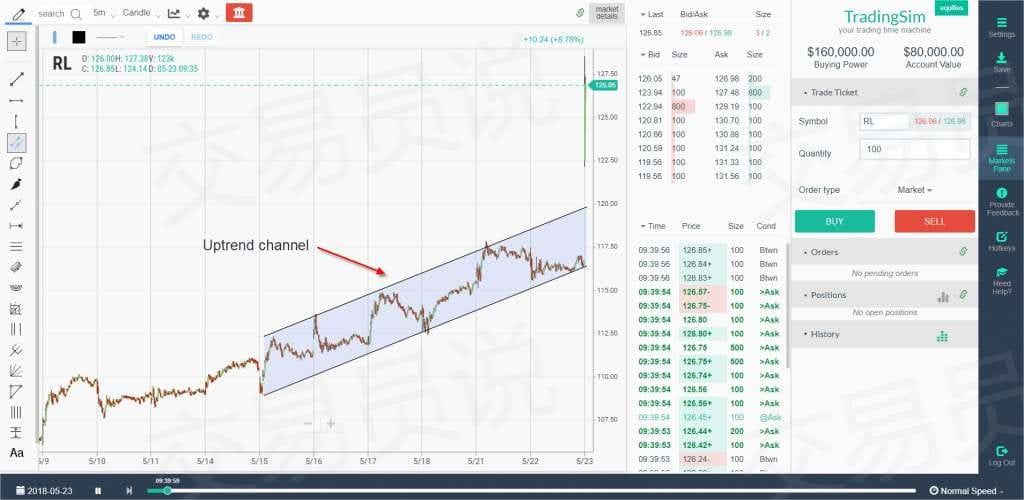
Trend channel
Furthermore, you can use trend channel drawing tools. These channels create a clean parallel line. However, these channels will not allow you to create wedge or diamond patterns.
Typically, trend channels work best in large-cap stocks: these are larger, more liquid companies.
Slope of the line
Another point to note is that you need to identify the minimum slope of the line that will trigger the formation of a trend.
Strong trends usually have a slope of over 50 degrees, thus forming strong upward momentum.
This is completely subjective. Nevertheless, if you are engaging in trend trading, then the trend should be strong enough to capture your attention.
Moving average
Moving averages are another excellent indicator you can use to assess trend strength.
In larger time frames, you can use a simple method to observe whether the price is above or below the 200-day moving average. However, another method is to look for strong trends where the moving averages do not cross during the upward movement. The spacing between moving averages indicates that the stock is strongly bullish across all periods (short-term and long-term).
To further illustrate this, we can filter out stocks where the 20-day, 50-day, and 200-day moving averages overlap on the daily chart. In other words, the 20-day moving average is above the 50-day moving average, and the 50-day moving average is above the 200-day moving average.
This tells us that the short-term moving averages are above the long-term moving averages, indicating an uptrend. Of course, the opposite is true for a downtrend.
Example of an upward trend
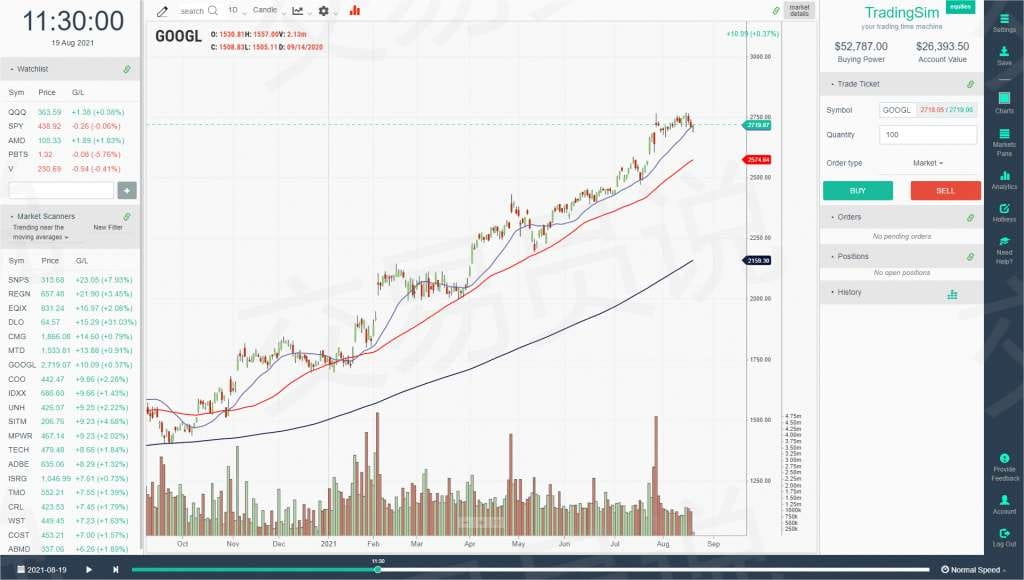
From the above chart, you can see that the purple 20-day moving average is clearly above the red 50-day moving average. Furthermore, below, the 200-day moving average is also sloping upwards.
These three moving averages are neatly arranged, giving strong signals that indicate the trend is very strong.
Non-trend example
Now that you know what a strong upward trend looks like, pay attention to the difference between the trends of GOOGL and XNCR.
Look, there are many oscillations in the market, right?
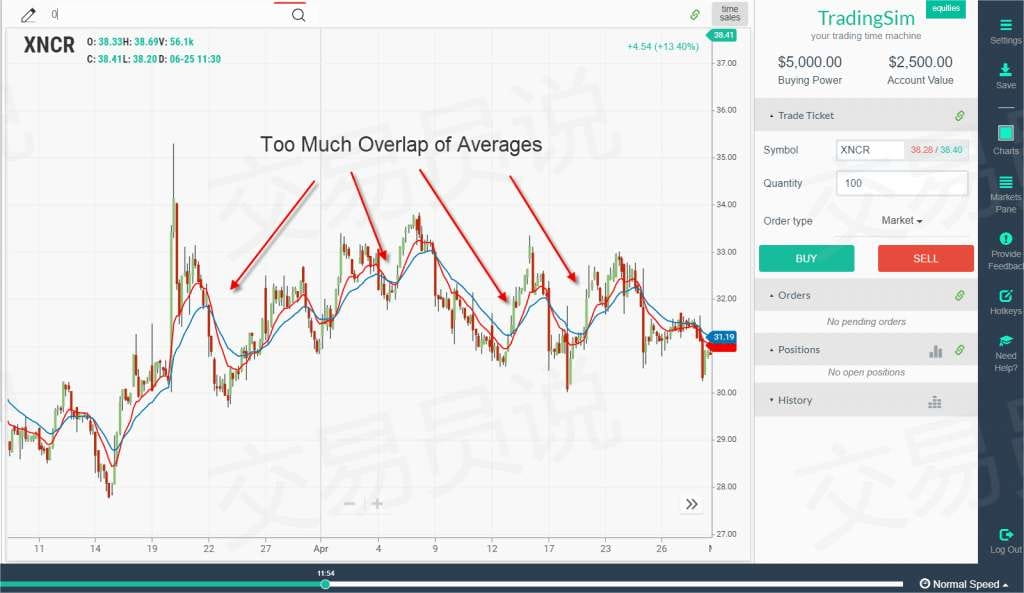
The above chart contains two moving averages, the 10-day and 20-day exponential moving averages (EMA). You can see the pullback situation between the 10-day and 20-day moving averages, which clearly indicates that the stock price is not in a strong trend.
Example of a downtrend
ABIO showed a significant sell-off after reaching about 18 US dollars at the peak. Since then, the stock price has never recovered.
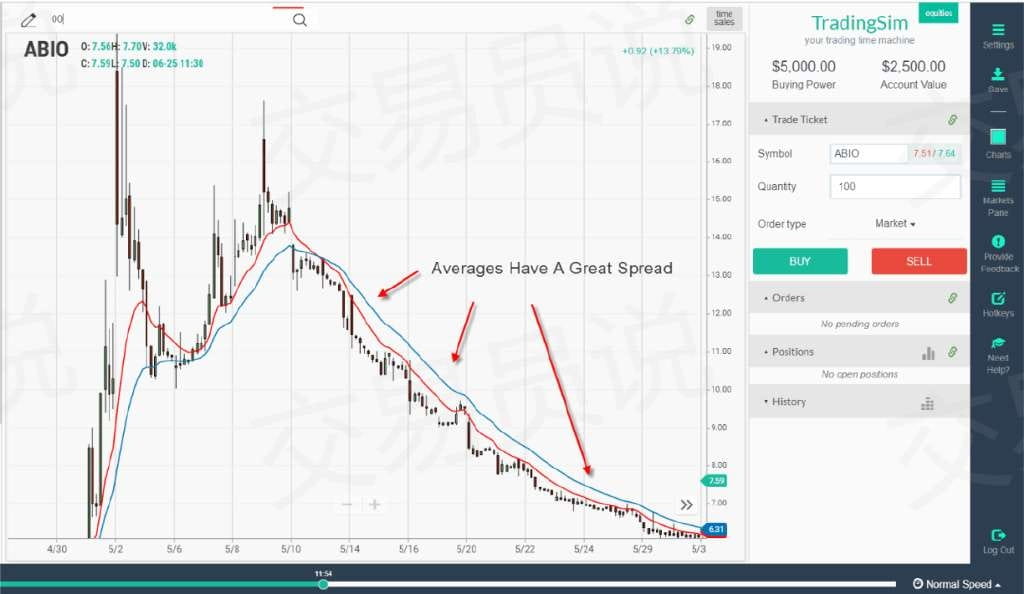
The chart above clearly shows a strong decline in stock prices. Notice that the moving averages do not cross during the decline. To enhance the effectiveness of the trend, the moving averages maintain a significant distance throughout the decline.
It should be noted that this trend is difficult to find. You certainly do not want to be on the wrong side. Unfortunately, some sell-offs will not provide a pullback, thus failing to offer opportunities for low-risk entries.
Momentum Oscillator
Another indicator you can use to analyze the market is the momentum oscillator. These indicators have no upper or lower limits, allowing oscillators to fluctuate with the stock price movement.
The TRIX indicator (Triple Exponential Average) is a momentum oscillator that fluctuates above and below the zero line. In the next chart, we will discuss a stock in a strong downtrend.
As this stock continues to decline, notice that the TRIX has remained almost entirely below the zero line.
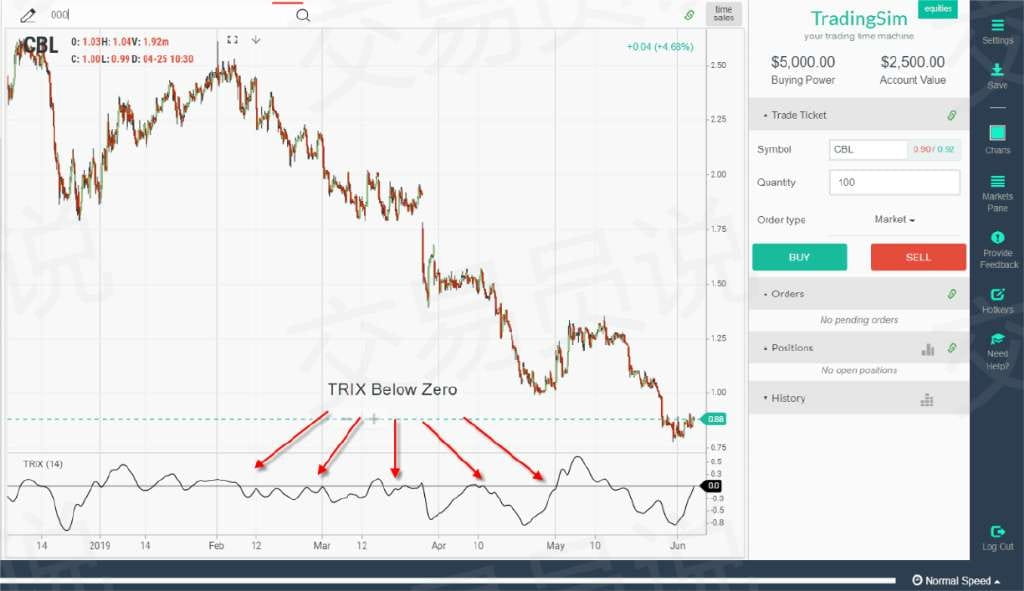
It is worth noting that TRIX does not react quickly since it smooths three exponential moving averages, making it a great indicator for measuring trends.
Observe how TRIX remains consistently below the zero line during the price decline. It is important to remember that this does not mean TRIX will not occasionally break slightly above the zero line.
Remember, in the market, price action rarely perfectly fits the frameworks set out in technical analysis books.
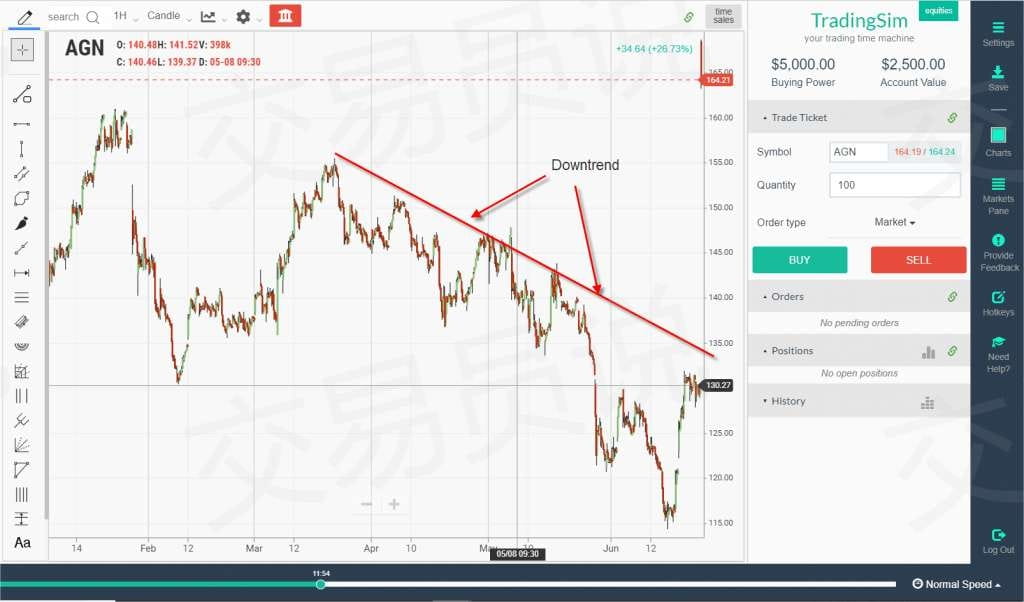
More trend trading examples
In our first example, we observe a stock that is clearly in a downtrend. You can see that the stock is forming lower lows and lower highs.
Next, we have a strong bullish uptrend, forming higher highs and higher lows.
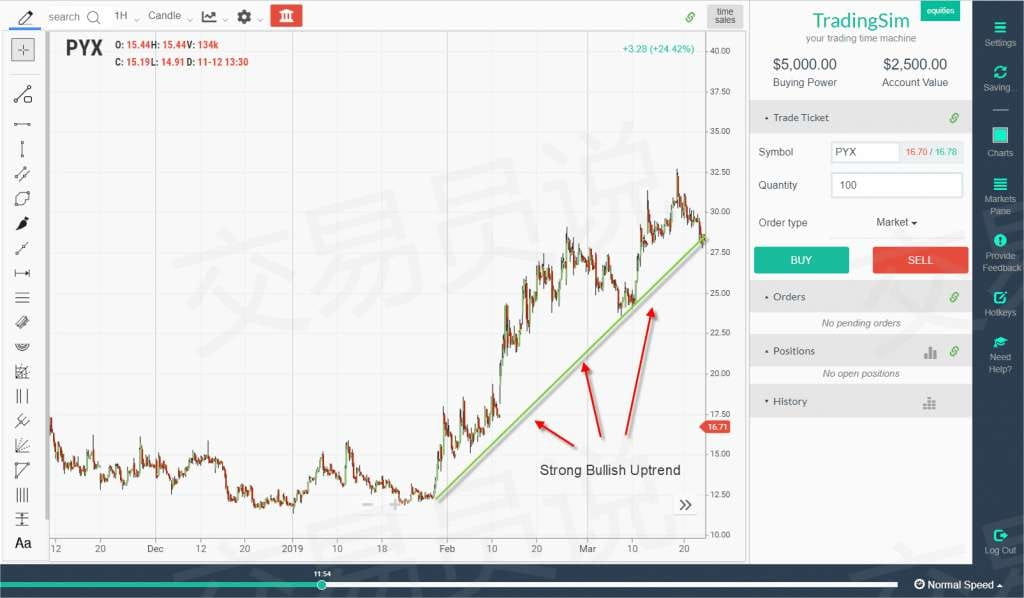
I hope these examples help you see different trends. Here’s another one:
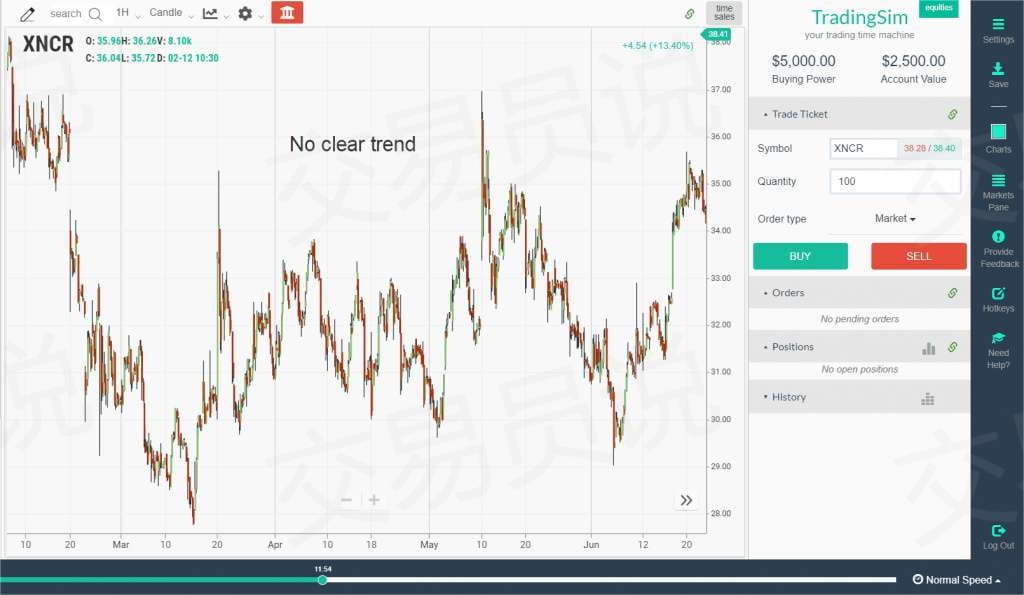
Can you see the lack of any trend in the above chart? This is what we refer to as a choppy market or securities lacking a clear trend. Most of these stocks are in a range-bound oscillation.
Reasons for trend trading failure
Trend trading, like any other strategy in the market, will never have a 100% success rate. Usually, a bullish trend fails when the price reaches a peak, breaks out of its channel, or when supply is too heavy.
Conversely, when the price experiences a sharp drop, or demand finds support, the downtrend will end.
The key is to study the trend and find consistency between volume and price action.
Not following stop-losses
When you trade a stock that is trending, you feel very good. You don’t need to do much, and money will continuously flow into your account. However, if you buy a trending stock at the moment of reversal, you may find yourself in trouble.
This is because entering too late can lead to a terrible reversal, causing the stock price to eventually drop back to its original point.
Therefore, you must use stop-losses; otherwise, trend movements will turn into your worst nightmare.
If you find yourself buying at the top of a strong trend, do not add to your position, as this violates the low points of each decline. This practice is called averaging down, which can lead to devastating consequences.
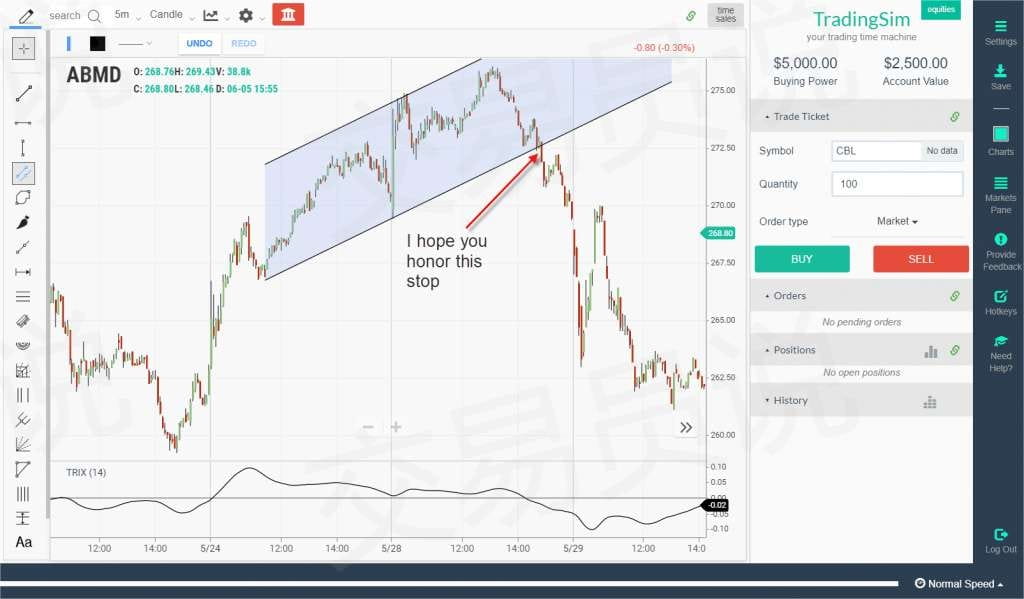
In the example illustrated above, we pointed out what happens if you buy support in a strong upward trend and the trend fails.
As you can see, if you do not set a stop-loss below the tested low point, things can quickly become very bad.
Strategies to join the trend
Now that you know what to avoid, let’s look at some strategies that help you smoothly join the trend.
1. Moving average pullback
In a strong trend, prices often pull back to important moving averages, such as the 20-day or 50-day moving average. These pullbacks, if the price continues to rise, usually provide a great opportunity to join the trend while maintaining lower risk.
Because institutions like to buy at lower prices, prices often find support at these levels.
Let's take the above GOOGL example and see how buying near the 50-day moving average is an excellent decision.
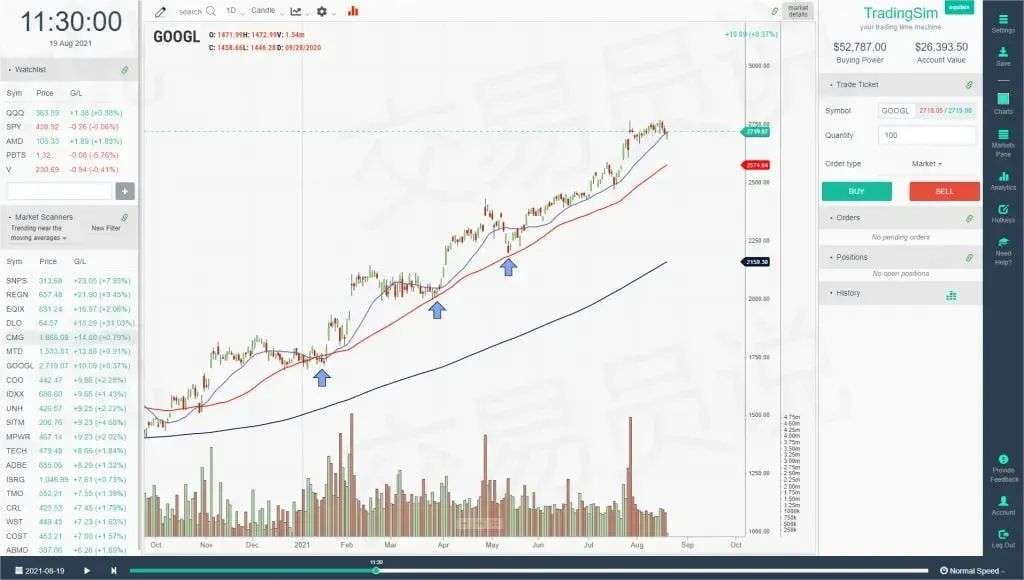
We saw three good pullback buying opportunities on the GOOGL chart, all occurring near the 50-day moving average, with arrows indicating these opportunities. Each buy was a great profit opportunity.
If the trade is unsuccessful, you can set the stop-loss below each consolidation range to control risk.
2. Mean reversion trend trading
If you do not like using moving averages, sometimes channels can be more effective. We removed the moving averages from the GOOGL chart, and this time we added a channel.
Notice that the buying point corresponds to the low point of the channel, while the selling point corresponds to the breakout at the high point of the channel.
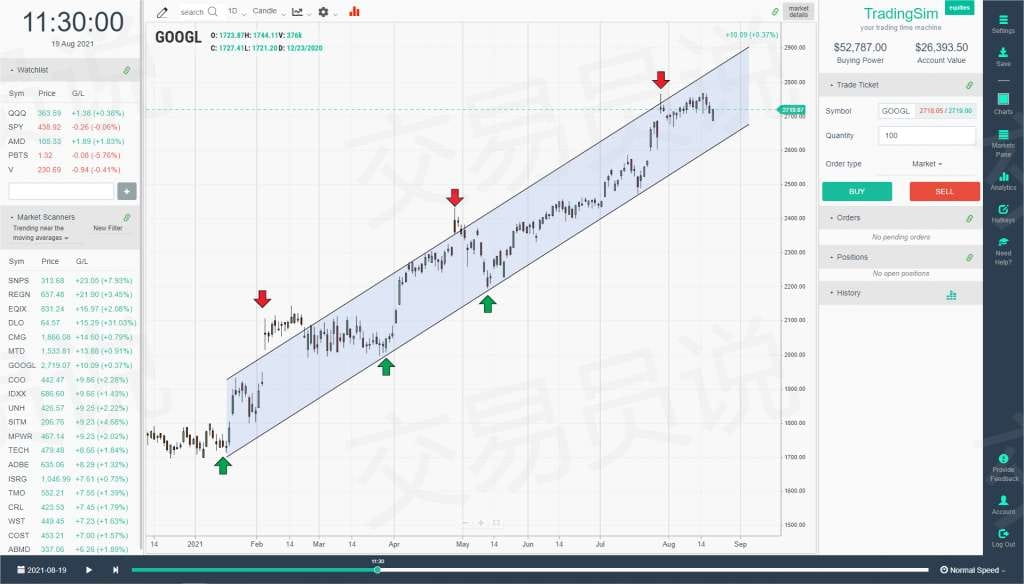
This can be a very simple and effective way to manage short-term positions. Essentially, you buy on pullbacks at support and sell at highs.
The key to trend trading lies in your entry points, stop-losses, and chosen trading methods. Whether using moving averages, channels, or oscillators, you need to master each method to develop your own edge.
The biggest difficulty in trading is not anything else, but the fear of losing money!
So how do you overcome your fear of losing money?
The great philosopher Russell once said: The fastest way to overcome your fears is to do the things you are afraid of. Aren’t you afraid of losing money? Then practice losing deliberately.
Step 1: Prepare 100 US dollars
Step 2: Lose this 100 US dollars within a week. But it's not about making random trades; you can't trade blindly, can't blindly increase leverage, can't get liquidated, must strictly set stop-losses, and must strictly execute according to the opportunities in your trading system.
Aren't you afraid of losing money? Don't you trust your trading system?
Come on! The best way to eliminate fear is to face it head-on, so go ahead and lose! This 100 US dollars is what you use to lose; if 100 US dollars isn’t enough, then come back with another 100 US dollars. When you feel numb about losses, then you have succeeded. At that point, you will understand what I often say: 'Losing money is normal, missing out is also normal; only by accepting this can making money also become your norm.'
Only through repeated losses and ongoing struggles with yourself can you transform and overcome the fear of loss. From now on, whether holding a position or entering the market, you will act decisively.
I secretly tell you that if you really do as I said above, the outcome is likely that you cannot lose everything, and you might even double your capital.
So at that time, you will feel compelled to increase your capital investment, but when you go all in with 1,000 US dollars or 10,000 US dollars...
You will find that your old problem has returned: what to do if you are still afraid of losing money?
Question 1: What should I do if I'm still afraid of losing money?
Adjust your position to an appropriate size
Question 2: What is the appropriate size?
A position that allows you to sleep soundly.
Question 3: When can I increase my position?
Able to sleep soundly even after increasing the position
But please note! The deliberate practice method I just taught you requires you to have your own trading system. If you don't even have a trading system, then you have no right to be afraid of losing money!
