

📊 BTC/USD Chart Analysis (Multi-Timeframe)
Timeframes Analyzed:
Daily: Trend is Bullish
4H: Consolidation, potential reversal from demand
1H: Ranging with upward momentum starting
✅ Key Observations Across Timeframes
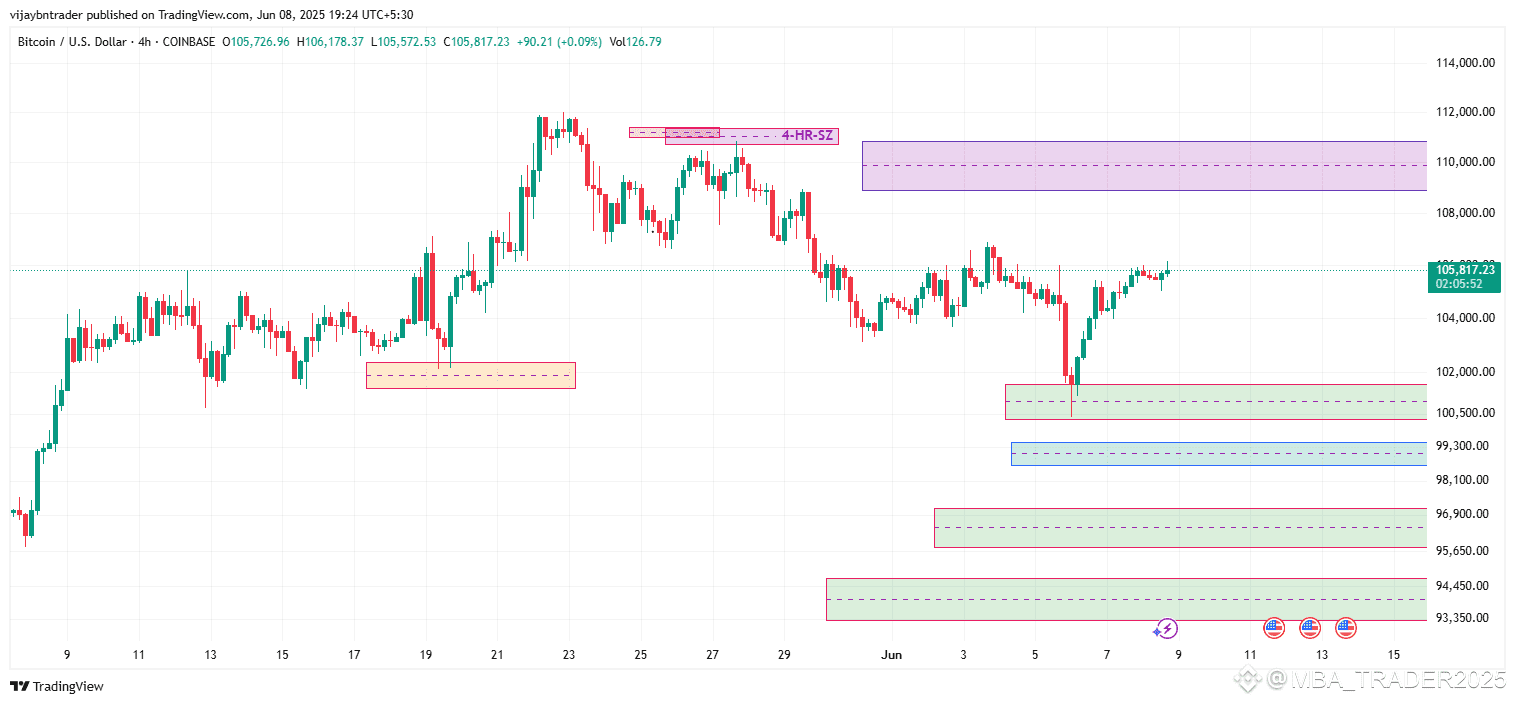
🟩 Demand Zones (DZ)
These are areas where buyers previously stepped in aggressively, and we expect buying interest again:
104,000 – 100,400: Orders filled here (confirmed reaction)
99,444 – 98,600
97,133 – 95,790
94,740 – 93,300
Note: Multiple 4H-DZ zones align with Daily-DZ, adding strength to the support.
🟪 Supply Zones (SZ)
Zones where sellers were dominant in the past:
110,000 – 108,000 (D-SZ)
106,850 – 107,450 (4HR-SZ)
These are your target areas or short-entry zones if price shows signs of reversal.
🔄 Current Price Behavior (as of 105,800)
Price bounced strongly from 104K support (Demand Zone hit)
Holding above the 50MA & 50EMA on Daily
Testing local structure resistance near 106K
Consolidation in tight range — building energy
🧠 What May Happen Next?
Most Likely: Retest of the 4H Supply at 106.8–107.4K, then test Daily SZ near 110K
If rejected from 110K: Expect fall back to 104K–100K
If price breaks above 110K with volume – potential for ATH attempt
If fails to hold 104K – potential slide to 99K / 95K / 94K (pending DZs)
🛠️ Trade Setup & Rules (from chart notes)
Buy only on Demand Zones
Sell only on Supply Zones
Use:
Proper Stop Loss (SL)
Minimum Risk:Reward = 1:2
Wait for confirmation (engulfing candle, trendline break, divergence, etc.)
📌 Summary:
📈 Bullish Bias remains until 104K breaks
🎯 Eyes on 110K as next resistance
🔄 Watch for pullbacks to re-enter longs
❗ Avoid chasing, stay within structure