Here is a comprehensive analysis – in Arabic – of Bitcoin's (BTC) performance until June 8, 2025:
⸻
📉 1. Recent Performance and Price Correction
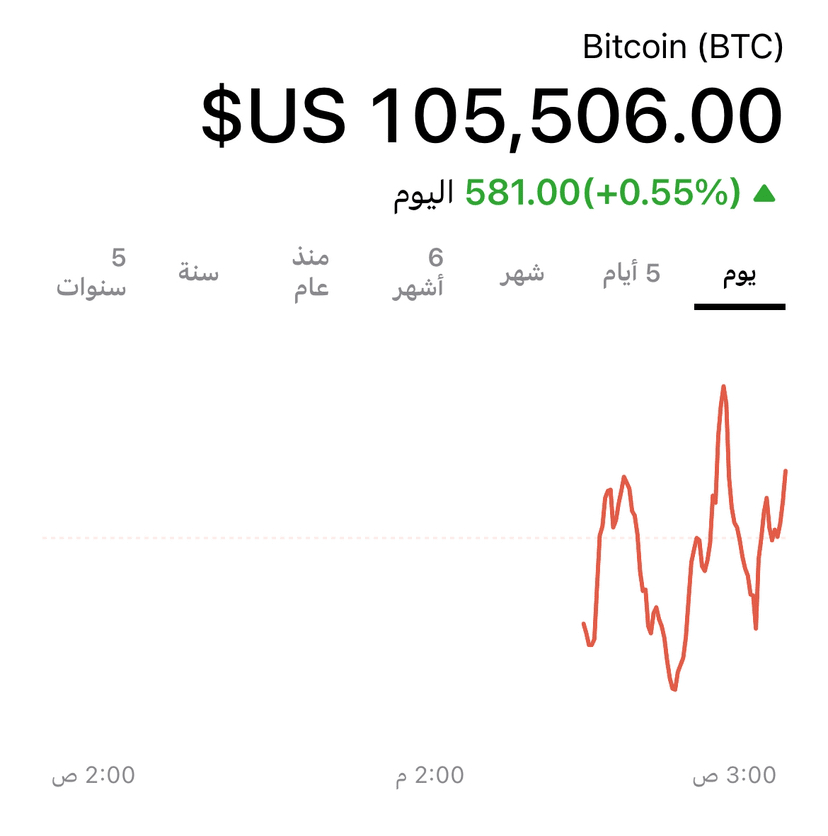
• The highest historical level reached by Bitcoin was around 111,880 $ on May 22, then it saw a decline of about 7% to settle around 104,000–105,000 $.
• The reason for this correction is attributed to technical factors (profit-taking by investors) and economic tensions, such as rising yields on US bonds following a court decision reinstating some trade tariffs.
⸻
🔍 2. Technical Analysis – Between Minor Correction and Signals of the Next Wave
⚙️ Technical Specifications:
• The “Golden Cross” pattern appeared in early June, typically preceding a strong upward wave. After its appearance, we witnessed a decline of about 8%, similar to the November 2024 pattern, paving the way for a recovery ranging between 50–60% reaching 150–158 $ by the end of 2025.
• The head and shoulders (H&S) pattern indicates the possibility of continued decline before resuming the upward trend.
• Critical Technical Levels: Strong support at 100,000 $, followed by 95,500 $; while the main resistance passes through 107–110 $.
📏 Indicators:
• RSI and MACD show mixed signals: some indicators support buying, while others are neutral between buying and selling.
• Current price movement is sideways between 103,800 and 105,800 $, with relatively low trading volume.
⸻
📊 3. Fundamental Factors – On-chain Activity and Institutions
• The number of daily active addresses has increased by ~15%, to around 850,000 addresses, indicating good activity within the network.
• Funding rates remain low, indicating caution among traders and lack of excessive accumulation of bullish bets.
• In terms of institutional investment, investment funds and ETFs are experiencing continuous weekly inflows, which may influence a new upward wave by activating the “buying crucible” once the disruption subsides.
⸻
📈 4. Future Predictions
🌱 Scenario Story:
1. Bullish Catalyst: Sustained closing above 108–110 $ on a weekly basis could trigger a strong upward wave extending towards 125–150 $.
2. Temporary Correction: Breaking the support level at 100 $ could push prices to 95,500 $ and possibly to 92–84 $ as a repositioning phase before the next surge.
⚠️ Warnings:
• Possible occurrence of a “Death Cross”: the 50 SMA curve crossing below the 200 SMA, which may raise the chances of a decline towards 74–80 $.
• History indicates summer volatility: with fluctuations ranging between 20–30% before the strong year ends.
⸻
🛠️ 5. Summary and Practical Tips
• Short Term (Days – Weeks): Period of technical tension between support at 104–100 $ and resistance at 107–110 $. It is best to wait for a clear break of either before taking a decisive position.
• Medium Term (Coming Months): If the golden pattern (“Golden Cross”) is activated and resistance is sustained, we may see Bitcoin rise to 150 $ by the end of 2025.
• Long Term: Continued support for Bitcoin from institutions and increased activity on the network enhances the chances of sustaining the upward trend, despite corrective periods.
⸻
✅ Quick Technical Summary
Scenario. Indicator Interpretation Expected Target
🟢 Positive Break above 110,000 $ Continuation of bullish momentum 125–150 $
⚠️ Warning Break below 100 $ General Correction or Negative Wave 95.5–84 $
🎯 Neutral Staying between 100–110 $ Accumulation period before taking direction Waiting for technical signals
⸻
🧠 Summary of Response
The Bitcoin market is currently hovering around a sensitive equilibrium area; a healthy technical correction after the standard, with strong support signals to break through resistance leading to a new upward wave. However, breaking support levels may cool the markets for a period. It is advisable to monitor prices momentarily, especially when approaching 100 $ or 110 $.
