I. Daily Level Analysis (Mid-Term Trend Direction Judgment)
Current Structure: The daily line has continuously closed with doji or small bullish candles for several days, indicating a tug-of-war between bulls and bears, in a critical direction choice period.
Technical Indicators:
Moving Average System: MA5 and MA10 are flat and aligned, MA20 is slightly pressing down, but the price has not significantly deviated, indicating a weakening bearish trend;
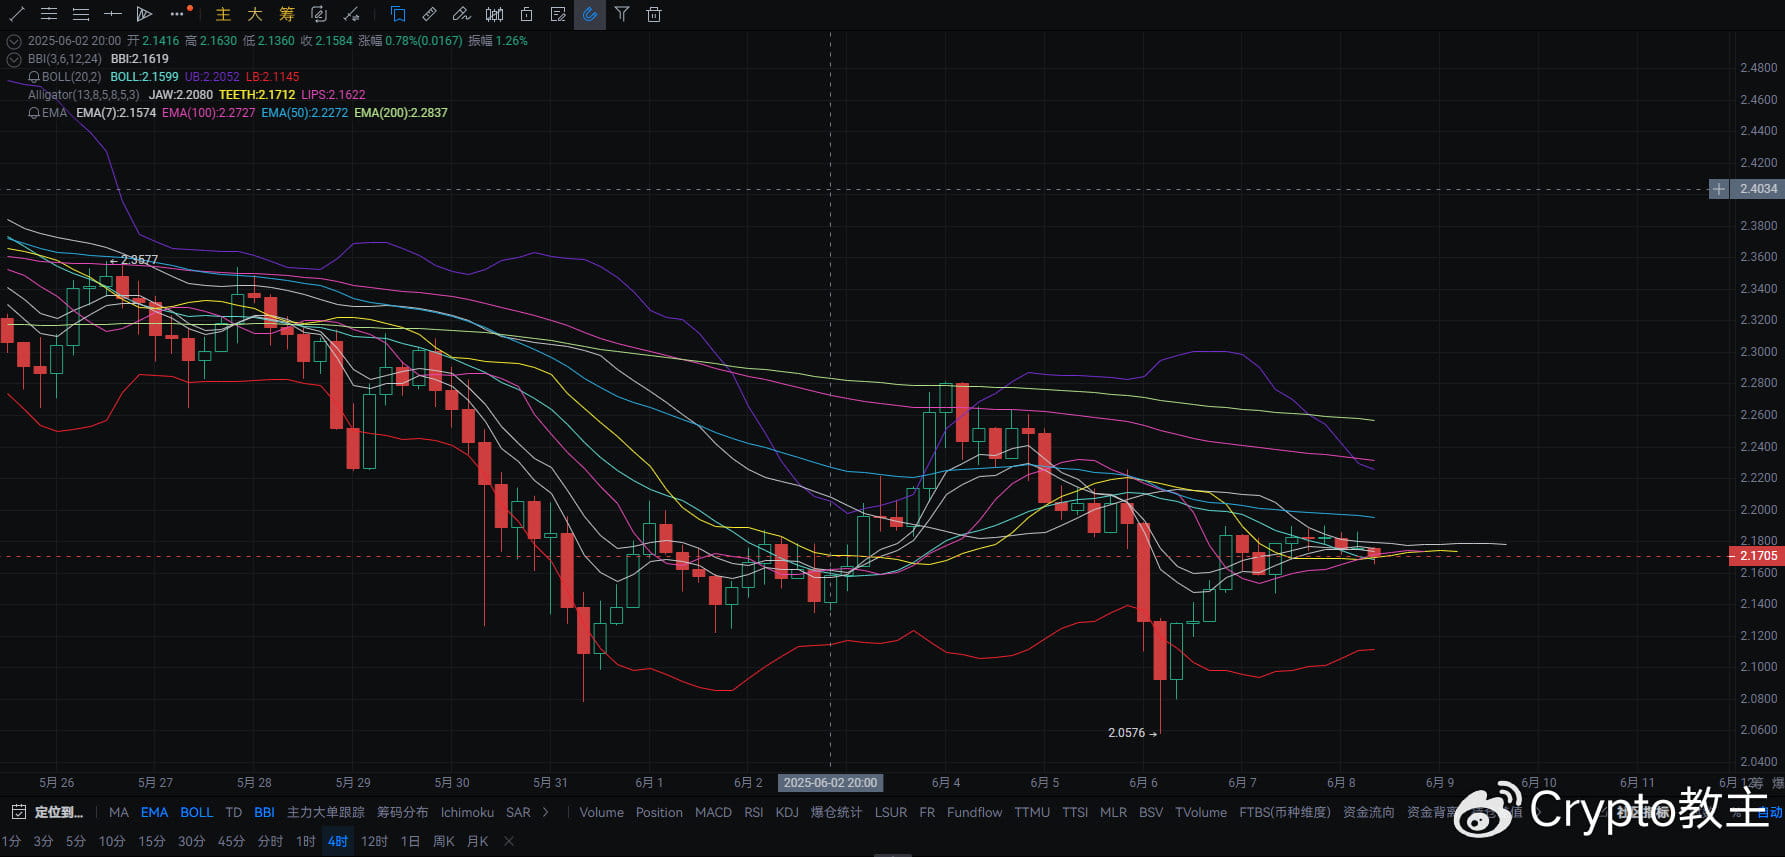
Bollinger Bands: The middle band is at approximately 2.1599, and the price is currently between the middle and lower bands, waiting for a direction choice;
MACD: DIFF and DEA are closely aligned at a low level, with signs of a golden cross, green bars are shrinking, leaning towards a bullish signal brewing.
The major downward trend is slowing, with clear signs of a bottom being formed; if it stabilizes above 2.18 during the day, it will trigger confirmation of a daily level rebound.

II. 4-Hour Line Analysis (Short-Term Rhythm Judgment)
Current Structure: The price has rebounded since hitting the bottom on June 6, continuously oscillating within a narrow range between EMA5 and EMA20.
Indicator Performance:
EMA System: After the death cross of EMA50 and EMA100 has slightly slowed down, EMA5, 10, 20 have formed a small bullish arrangement, slightly bullish in the short term;
Alligator Indicator: The JAW, TEETH, and LIPS have converged, indicating a typical calm pattern before an explosion;
Bollinger Bands: The contraction is significant, indicating a sharp decline in price volatility, facing a moment of direction choice;
Trading Volume: After a significant increase in volume yesterday, today's volume continues to shrink, indicating a high possibility of the main force consolidating power.
The 4-hour line is entering a critical point of consolidation, and the main force may choose to break through in a certain direction; combining yesterday's low point support and the current moving average arrangement, going long is more cost-effective.

III. 1-Hour Line Analysis (Ultra-Short-Term Rhythm and Entry Timing)
K-Line Structure: Multiple piercings of 2.17 but without significant volume breakdown, showing strong buying support below;
EMA Indicator: EMA5, 10, 20, and 50 moving averages are tending to converge and flatten, and a directional breakthrough may occur within 60 minutes;
MACD Signal: After the golden cross, there have been repeated fluctuations, although the red bars are small, they are persistent, showing obvious signs of bottom support.
Bollinger Bands: The band width is narrowing, and the price is close to running along the middle band, suggesting a high probability of a short-term breakout;
Conclusion: The hourly line may choose a direction at any time; from the perspective of form and volume, the probability of an upward breakout is slightly greater than that of a downward break.
Operation Suggestion (considering intraday fluctuations and support/resistance levels)
Opening Position: 2.17
First Target: 2.20
Second Target: 2.23
Stop Loss Position: 2.13


