Choosing a time frame for intraday trading is a very important decision, but there is no definitive answer. The appropriate time frame varies from person to person, depending on their trading strategy and how they prefer to spend their trading time (relaxed or tense). Here are the pros and cons of each intraday trading time frame for you to decide which one suits you best.
Intraday traders can choose to trade either a single time frame or multiple time frames. Here are common time period examples: 1 minute, 5 minutes, 15 minutes, 30 minutes, 60 minutes, and Tick Chart + (based on a fixed number of trades).
. Smaller time periods (like 1 minute): provide more details and are suitable for fast trading, such as scalping.
Longer time periods (like 15 minutes): less detail, smoother charts.
5-minute period: balances detail and smoothness.

It is recommended to analyze using multiple time frames: look for trading opportunities on longer time frames, then switch to shorter time frames to determine precise entry points and smaller stop-loss levels.
1. For example, on the 60-minute chart, a triangle pattern is approaching the breakout point.
2. Switch to a 1-minute chart and set the stop-loss below the recent swing low on the 1-minute chart. This is usually closer to the current price than the swing low on the 60-minute chart.
3. Smaller stop-losses mean larger position sizes and higher potential profits.
4. Use target profit levels on the 60-minute chart to achieve a higher risk-reward ratio. When the price approaches the target, switch to the 1-minute chart and exit on reversals to avoid giving back too much profit.
Look for and observe patterns on longer time frames. Patterns on shorter time period charts appear and disappear quickly. If a broader perspective is needed, we can simply zoom out (compress the chart).
Advantages and disadvantages of various intraday trading time frames
Charts can be broken down into different time frames, including 1-minute, 5-minute, 10-minute, 15-minute, and other time frames beyond that. We'll analyze these time periods one by one, discussing their advantages and disadvantages, and which trading styles suit them.
Please read the analysis for each time frame carefully, as they are compared to each other.
Before we start, here is a chart showing the differences between the 1-minute, 5-minute, and 15-minute charts. They all display price data for the same day for 11 hours, but there are significant differences in detail.

There is no superiority between the two, but one time frame might suit you better because it might offer more trading opportunities or the charts appear clearer. Additionally, combining multiple time frames is also feasible. We will discuss how to use multiple time frames later.
1-minute chart time frame
The 1-minute time frame may be suitable for those who enjoy observing price movement details and wish to enter and exit the market through short-term trades (lasting only a few minutes).
If you want to trade on a 1-minute chart, build and test your strategy on the 1-minute chart.
Trading on a 1-minute chart requires almost continuous attention, as a new candlestick is generated every minute, and trading signals may occur frequently (depending on the strategy).
Due to the frequent appearance of price candlesticks, 1-minute chart traders typically have more opportunities to trade than traders on longer time frames. If there is a profitable system, more trades mean more profits and faster account compounding. However, without a profitable strategy, traders may quickly incur losses.
For trades based on smaller candlesticks (rather than higher time frames), stop-loss and profit target levels are often smaller than those used by higher time frame traders. But this is not absolute. Traders can use smaller stop-losses on a 1-minute chart while pursuing larger risk-reward ratios, as waiting for larger profits may mean fewer trades throughout the day.
Since stop-losses may be small, position sizes can be very large.
Position sizes in forex trading may require leverage of 20 times, 50 times, or even 100 times, while still controlling trading risks within the account balance.
Less than 1%. Currently, many brokers offer leverage of 100 times or even higher.
In the case of U.S. stocks, the position size for intraday trading is usually (but not always) limited to 4 times leverage. This means that even if each trade only risks 1% or 0.5% of the account balance, most of the funds in the account (including maximum leverage) can be easily utilized (without taking on that much risk, one can afford to take less). An intraday trade may occupy most of the available funds in the account, leaving very little for other trading activities such as swing trading. You can choose to allocate a specific amount for intraday trading and use the remaining funds for other trades.
Trading with a fixed 2:1 risk-reward ratio.
The following stock intraday trading charts show some trades and potential trading opportunities (missed) using a 2-minute chart. The 2-minute chart has slightly less detail than the 1-minute chart but more than the 5-minute chart.

Main conclusion: The 1-minute chart is suitable for those who want to maximize trading time through more trades, typically using larger position sizes and smaller stop-loss and profit targets (but targets can be expanded if necessary).
5-minute chart time frame
The 5-minute chart may be suitable for those focusing on larger intraday trends and who do not need to check the opening price, high, low, and closing price every minute, but rather prefer to receive summary data every 5 minutes.
If you want to trade on a 5-minute chart, build and test your strategy on the 5-minute chart.
Trading on the 5-minute chart requires focus but does not need the continuous attention required by the 1-minute chart. A new candlestick forms every 5 minutes, so the time interval between data points is longer. If traders wait to act after a candlestick closes, it means there will typically be at least one action every 5 minutes, which usually takes longer.
Traders on 5-minute charts typically execute fewer trades than those on 1-minute charts due to fewer actionable data points (candlesticks).
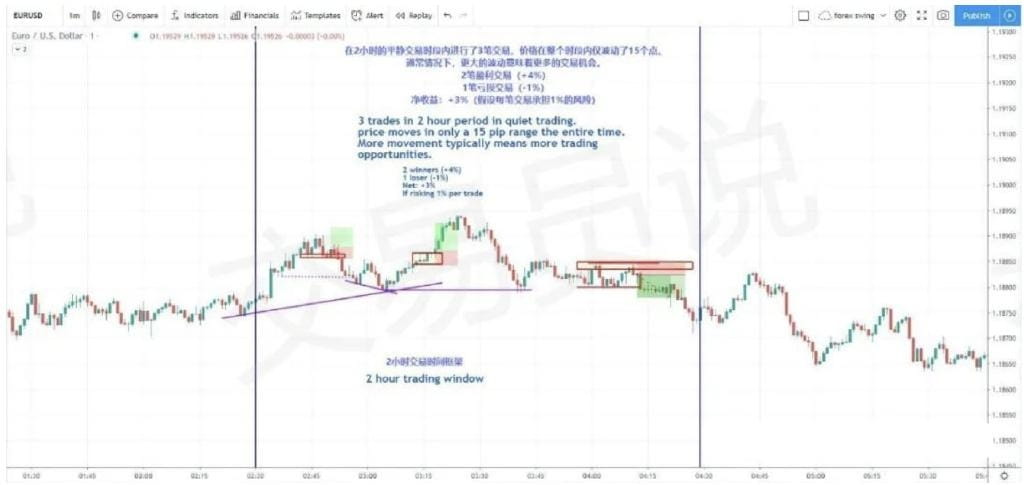
In a two-hour trading window, there may be one to two trades, or even more, but fewer than on a 1-minute chart.
Stop-loss and profit target levels are generally larger than those on the 1-minute chart. There is no good or bad in itself, but it usually means fewer trades per day.
Since the candlesticks on the 5-minute chart are larger, position sizes are usually smaller than on the 1-minute chart, meaning the distance between selected entry and exit points may be larger.
Since the position size is slightly smaller than on the 1-minute chart, traders may be able to hold multiple positions simultaneously. Similarly, you can allocate a specific amount for each intraday trade to ensure sufficient funds for all positions you wish to hold.

Trading with a fixed 2:1 risk-reward ratio
Each part of the EUR/USD (EURUSD) chart represents the same day but with different time frames, affecting the number of trades and entry points.
Here are some examples of stock intraday trading using a 5-minute chart:

Main conclusion: The 5-minute chart is suitable for those who wish to focus on larger intraday price fluctuations, receive fewer data points, and use medium position sizes (smaller than the 1-minute chart but larger than longer period charts).
10-minute or 15-minute chart time frame
10-minute or 15-minute charts are suitable for those who want to see the main trends and price movements throughout the trading day, rather than every small fluctuation (like on 1-minute or 5-minute charts).
If you want to trade on a 15-minute chart, build and test your strategy on the 15-minute chart.
Trading on 10-minute or 15-minute charts requires less continuous attention as the candlesticks take longer to form. If you wait for the candlestick to close (which is not necessary), there will be at least a 10 to 15-minute interval between each possible action.
Traders using this time frame may only execute one or two trades daily. Trading several days within a two-hour or shorter time frame may yield no trading signals. Trading this time frame might require more screen time because the time for entering and exiting trades is longer.
Stop-loss and profit target levels are generally larger than those on the 5-minute chart. There is no good or bad in itself, but it usually means fewer trades per day.
Due to the larger candlesticks on 10-minute or 15-minute charts, the position size is usually smaller than that of the 5-minute chart, which means the stop-loss distance may be larger.
Fewer trades and smaller position sizes make it easier to hold multiple positions at once.

Main conclusion: 10-minute or 15-minute charts are suitable for traders who want to focus on larger price movements throughout the day. They do not mind waiting longer to open and close positions. They prefer clearer price trends and may only execute one or two trades during several hours of trading.
Summary comparison of the best intraday trading time frames:

Since 1-minute candlesticks form the fastest, you will usually get more trading opportunities on the 1-minute chart. Scalping is also the fastest because a new candlestick forms every minute, providing new information.
The position size on the 1-minute chart is the largest because stop-losses are very small; we can use all funds plus leverage, risking only 1% of the account on each trade. This means capital consumption is also very high. As mentioned earlier, if you risk a fixed percentage of the account on each trade, you may end up using all your funds on a trade with a small stop-loss.
Interestingly, the amount of capital required for a 1-minute chart is the least since stop-losses are typically the smallest, meaning even small accounts can often control their risk at 1% or lower. As the stop-loss size increases, the amount of capital required to trade in a risk-controlled manner also increases.
The new candlestick forming every minute means that our psychological focus is highest on the 1-minute chart, while on longer time frames, the focus tends to decrease due to lower frequency of new candlestick/information appearances.
Multi-timeframe analysis
Some traders only use a single time frame for trading, while others use multiple time frames to look for trading opportunities.
When trading on a single time frame, if you spot a trading opportunity on that time frame, simply proceed to trade without needing to check other time frames for confirmation.
Multi-timeframe trading means you can look at longer period charts and use them as a filter for lower time frame trading. For example, traders may look at 5-minute or 10-minute charts to determine the overall trend direction and then seek entry opportunities aligned with the trend on a 1-minute chart. Alternatively, they may use a 30-minute chart to determine the overall direction and then use a 5-minute or 10-minute chart for entry.
The left side of the chart below is a 60-minute chart of Draftkings (DKNG), while the right side is a 5-minute chart. The 60-minute chart provides a potential trading opportunity, and then the 5-minute chart is used to find entry and stop-loss points. The 60-minute chart also provides some reference for the potential price movement, although we cannot determine the specific range within a single trading day (for intraday trading).

There is no perfect combination or answer. A profitable trading system can be built on any time period or any time frame combination. However, understanding the advantages and disadvantages of each time period should help you determine which is best for you.
Alternative options for intraday trading chart time frames -- Tick Chart and Renko Chart +
Time periods are often discussed as the sole chart option, but this is not the case. There are also some chart types based on other factors.
@ Tick Chart: Based on a fixed number of trades. Once a certain number of trades are reached, a candlestick will form. This means that during busy trading periods, candlesticks may form quickly, but during quiet trading periods, it may take minutes or even hours to form a single candlestick.
Tick charts are a great way to understand situations beyond market cycles. The trading volume during these hours is thin and scattered, but when aggregated, they form some potentially meaningful small blocks.
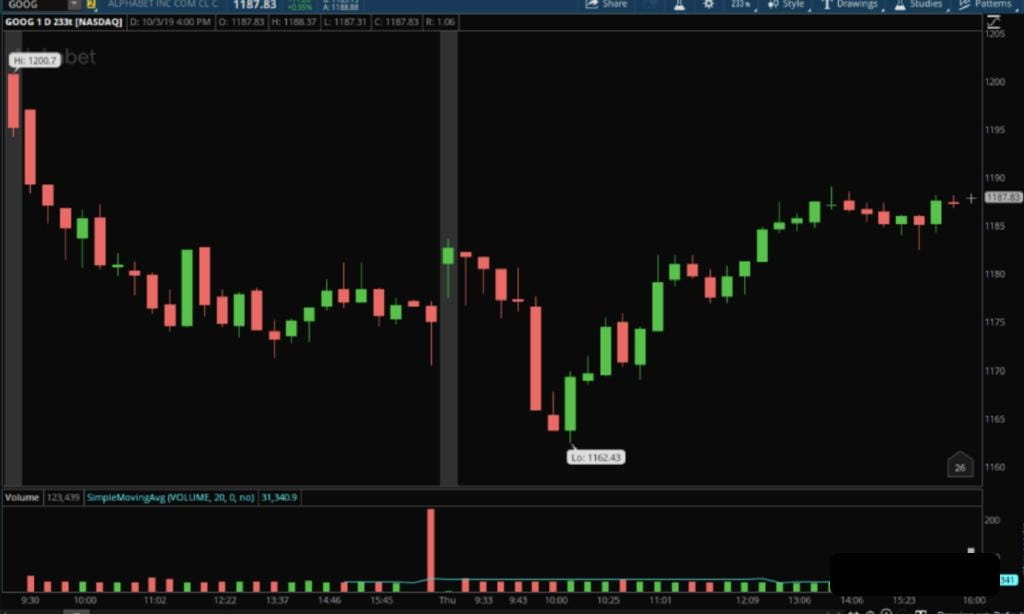
Below is the difference between the same asset on a 15-minute candlestick chart and on a tick chart with a 233 scale:
15-minute chart:

Tick chart with a 233 scale:
Recognizing trend exhaustion
By equalizing the trading levels of each candlestick, those erroneous trends that create candlesticks will be reduced, as erroneous trends are merely low-volume trades. Generally, in such cases, once the volume increases, the trend reverses.
When to use tick charts
Some traders prefer to mix various chart types. Switching to tick charts in slow, range-bound markets makes sense, as time-based chart types will only frustrate you. Using tick charts allows you to trade only after a certain number of market transactions occur.
When the market experiences high volume and volatility, tick charts make adjustments simple. You just need to choose a larger tick scale. Perhaps you are using a 1000-point scale, or maybe try a 2000-point scale. Conversely, during a low-volatility lagging period in a bull market, it is necessary to reduce your tick scale.
Tick Chart vs Renko Chart
Tick and Renko charts are based on price changes rather than time or volume, although they do have some key differences.

Renko charts focus on price direction. They create a price bar that rises or falls based on a given number. For example, you can set your chart platform to create a new Renko bar whenever the market moves up or down by 10 points.
Tick charts are somewhat directionless in that they only focus on trading activity, creating a new trade bar for each specific transaction without considering direction.
@ Renko Chart: A brick chart based on price movement. A brick forms once the price moves a certain distance. As long as the price continues to move in the same direction and reaches the required distance, bricks will continue to form. If the price reverses by a distance equal to two brick sizes, the brick changes color and starts moving in the opposite direction. Bricks are not based on time but on price changes.
If you use candlestick trading, how easy is it to find support and resistance? How much do you need to zoom in to see these ranges? This time, let's start from the brick chart. The chart below is based on a 50-point fluctuation of EUR/JPY.

Look how clean and neat these reversal areas are! Let's try to find the same signals on candlestick charts.

Brick chart and support strength
You can see many similarities between the two types of charts. However, drawing support and resistance from a candlestick perspective can be quite ambiguous. There is a lot of subjectivity and extra work needed to determine the exact support and resistance ranges. Let's see how much easier it would be to trade using a brick chart.

Using brick charts for trading provides a clearer example of these support and resistance areas. Even if you prefer using candlestick charts, utilizing brick charts as a supplementary tool to detect price changes can be very effective.
(Important Note: Candlestick charts remain the preferred and most useful charts for price action traders. You can use brick charts to verify if your trades align with the trend.)
Let's return to the daily chart of EUR/JPY and note that we have not changed these blue support and resistance lines.

In this article, we explore how brick chart trading effectively validates some excellent and brilliant price action trading theories. We can clearly see the candlestick patterns that fail the range test, such as double tops and triple tops, tweezers tops and bottoms, and inside bars. Trading using brick charts not only allows for success based on one's efforts but can also supplement the analysis of candlestick trading that has its shortcomings and flaws.
The chart time frames I use in trading.
Forex intraday trading: I use a 1-minute chart.
. Stock intraday trading: I use a 1-minute chart, but if I try to capture larger fluctuations, I may switch to a 2-minute or 3-minute chart.
Stock swing trading: I only use daily charts. If I have time, I occasionally check other time periods.
Forex swing trading: I look for patterns on daily, 4-hour, and hourly charts. I usually trade based on the single time frame I am observing. Sometimes, if I spot a favored trading opportunity on these longer periods, I might switch to a 5-minute chart to find entry points and maximize my risk-reward ratio (stop-loss based on the 5-minute chart, targets based on the 4-hour or hourly chart, depending on the time frame used). During high price volatility, I may also use Renko charts.
Finally, ten trading tips are summarized. Understanding one can lead to stable profits, worth learning repeatedly:
1. Two-Way Trading: Suitable for bull and bear markets. Two-way trading is the most common trading method currently, and it allows for investment operations based on market trends, enabling both long and short positions. As the year-end approaches, this platform is rolling out a series of promotional benefits, such as a 20% increase in investment returns, which is a big boon for investors.
2. HODL Method: Suitable for bull and bear markets. The HODL method is the simplest yet the hardest way to play. The simplest part is just buying a coin or a few coins and holding them for half a year or more without trading. Basically, the minimum return can be tenfold. However, beginners easily see high returns or encounter price drops, planning to switch or exit, and many find it hard to hold for a month, let alone a year. So this is also the hardest part.
3. Bull Market Buying the Dip Method: Suitable only for bull markets. Use a portion of idle money, preferably not exceeding one-fifth of your funds. This method is suitable for coins with a market cap between 20-100, as they won't be stuck for too long. For example, if you buy the first mountain coin and it rises by 50% or more, you can swap it for the next coin that is plummeting, and continue this cycle. If you are stuck with your first mountain coin, just wait; a bull market will definitely help you break even. The precondition is that the coin cannot be too much of a trap; this method is also hard to control, and beginners need to be cautious.
4. Hourglass Switching Method: Suitable for bull markets. In a bull market, basically any coin will rise; the funds flow like a giant hourglass slowly dripping into each coin, starting from the larger coins. Price rises follow a clear pattern, with leading coins rising first, such as BTC, ETH, DASH, and ETC, followed by mainstream coins like LTC, XMR, EOS, NEO, and QTUM. Then, the coins that have not yet risen will see a general rise, like RDN, XRP, ZEC, etc., followed by various smaller coins taking turns to rise. But if Bitcoin rises, you look for the next level of coins that have not yet risen and start building positions.
Pyramid Bottom Buying Method: Suitable for predicting large crashes. The bottom-buying method involves placing orders to buy 10% of your total position at 80% of the coin price, 20% at 70%, 30% at 60%, and 40% at 50%.
6. Moving Average Method: Understand some basics of candlesticks. Set the indicator parameters to MA5, MA10, MA20, MA30, MA60, and select a daily level. If the current price is above MA5 and MA10, hold steady. If MA5 falls below MA10, sell the coin; if MA5 rises above MA10, buy and build positions.
7. Aggressive HODL Method: Focus on coins you are familiar with, suitable only for high-quality long-term coins. Have some liquid funds; if a coin is priced at 8 USD, place an order to buy at 7 USD, and upon successful execution, sell at 8.8 USD. Profit stays in the liquid fund. Keep waiting for the next opportunity, adjusting dynamically based on current prices. If there are three such opportunities in a month, you can accumulate quite a few coins. The formula is that the acquisition price equals the current price multiplied by 90%, and the selling price equals the current price multiplied by 110%.
8. ICO Aggressive Compounding Method: Keep participating in ICOs, and once a new coin rises by 3-5 times, take out your principal and invest in the next ICO, with profits kept aside, continuously cycling.
9. Cyclical Swing Method: Look for coins like ETC that are underperforming; increase your positions as the price continues to drop, then continue to add positions as it falls, and wait for profits to sell off, continuously cycling.
10. Small Coin Aggressive Method: If you have 10,000 RMB, divide it into ten parts, buying ten different types of small coins, preferably priced under 3 RMB. After purchasing, do not interfere. Hold until they have tripled to five times before selling; do not sell if stuck. If a certain coin triples, withdraw 1,000 RMB of the principal and invest in another small coin. The compound returns can be staggering!
One cannot succeed alone; a single sailboat cannot sail far! In the crypto circle, if you do not have a good circle or insider information, I suggest you follow me to get on board, and welcome you to join!!!