Coin Name: $BTC
The BTC/USDT daily chart shows a falling wedge pattern, typically bullish. Price is nearing the wedge's resistance. If BTC breaks out above this resistance with volume, it could signal continuation of the uptrend. RSI is recovering, and the stochastic is bottomed out, suggesting upward momentum. A breakout could push BTC towards the $111K level, as indicated by previous highs and technical projections.

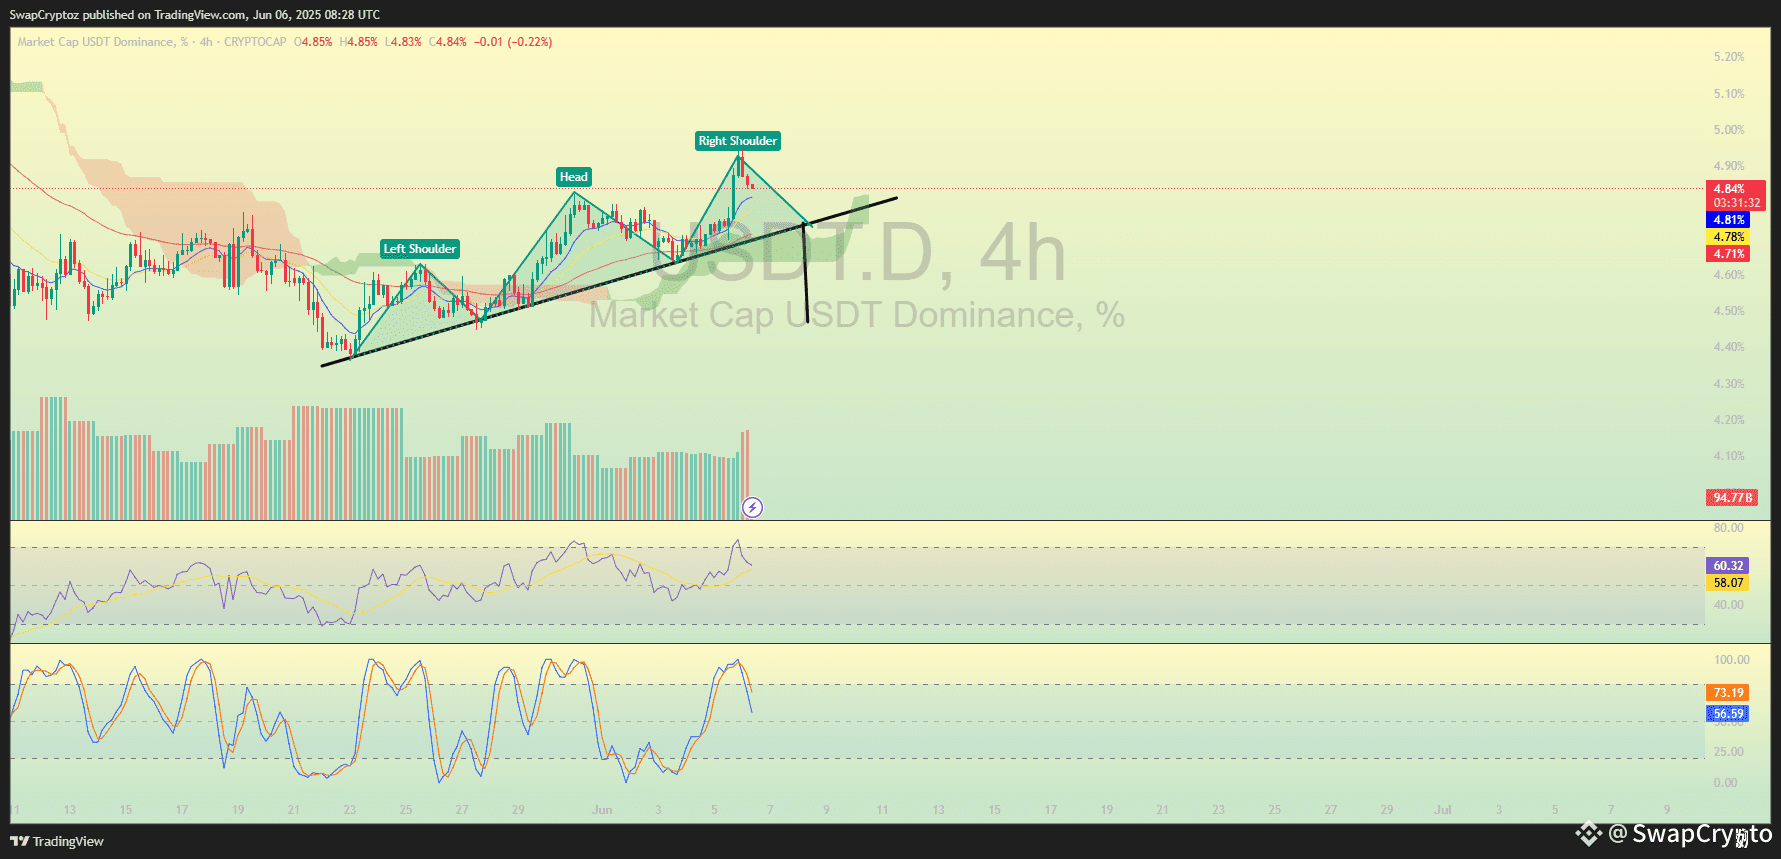
The 4H USDT Dominance chart shows a clear Head and Shoulders pattern, signaling a potential bearish reversal. If dominance breaks below the neckline support, it confirms the pattern, suggesting capital rotation out of USDT into crypto assets. This would likely trigger a strong BTC rally. Watch for volume confirmation on the breakdown—if it occurs, BTC could see significant upward momentum shortly after.
This heatmap shows strong liquidity above current BTC price levels, suggesting potential for a bullish move. Price is steadily climbing with minimal resistance—bullish momentum is likely building.

ENTRY: 101054.67
buy some BTC coin now then do DCA when it's come to the near at entry price .
1st TP: 107768.81
2nd TP: 110064.25
3rd TP: 111326.74
For more details, check out my bio by clicking on my profile.
This signal is for spot trading only. If you're interested in future signals, join my live Binance session.
Simply click on my profile to join!
#swap_crypto #BTC #swapcryptoz