Review of yesterday (June 5)
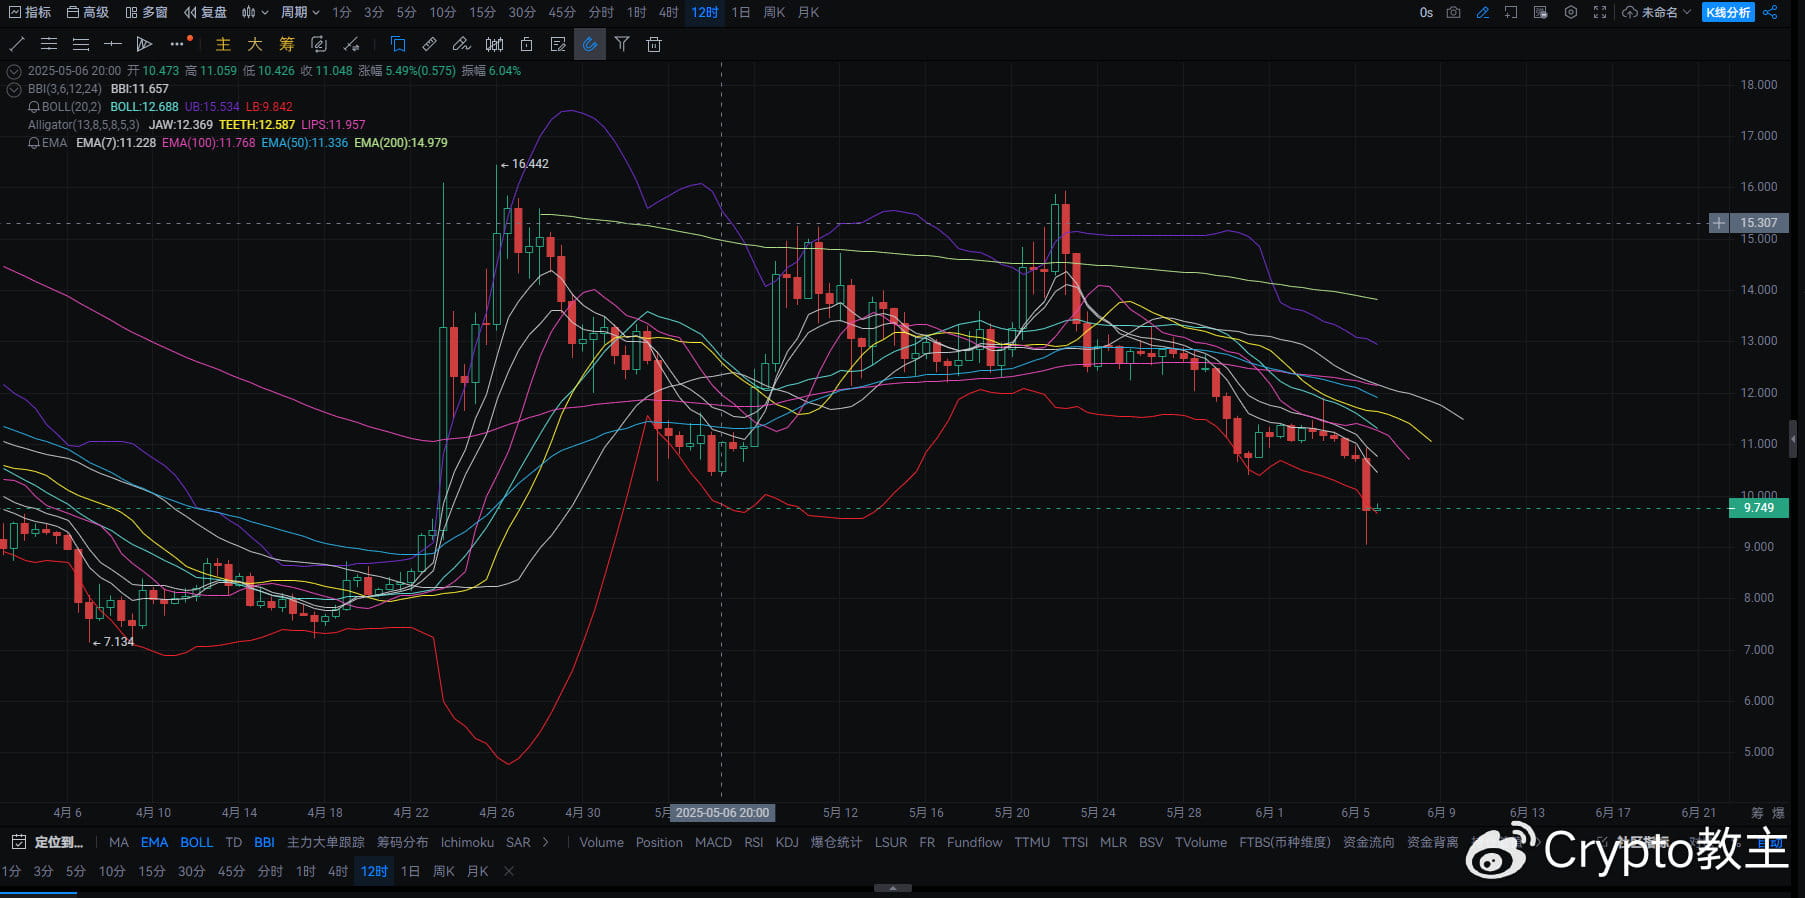
TRUMP experienced a 'guillotine-style' crash yesterday, with the price plunging directly from around 11.5 to a low of 9.04 USDT, a nearly 22% drop in a single day, considered a bloodbath. Following the crash, a bottom-fishing rebound has emerged, and today's market enters the **'critical point of long and short balance'**, will it continue to squat deeply or quickly counterattack? Key support and rebound windows are gradually becoming apparent.
Multi-cycle technical analysis (June 6, 2025)
Daily level: Long bearish candle washing out, preliminary signs of a stage bottom
Yesterday's large bearish candle broke through several important supports, but the long lower shadow + close indicates that bottom-fishing funds have entered the market;
Current price is above 9.70, confirming yesterday's lowest point;
BOLL opening expands, price deviates from the lower track beyond normal, indicating the expectation of correction;
The EMA system is still in a bearish arrangement, but the price is far from the moving averages, and the technical aspect is obviously oversold;
MACD green bars are expanding but are at a low level, and the short-term downward trend is slowing down;
RSI rebounded after breaking below 30, entering an extreme oversold range.
Conclusion: Although the daily line is still in a bearish structure in the short term, the demand for a technical rebound is extremely strong, and the atmosphere for bottom-fishing is gradually intensifying.

Four-hour chart: After extreme volume breakdown, there is hope for a rebound confirmation
The last large bearish candle yesterday had significant volume, suspected to be a panic sell-off;
Current price is oscillating in the range of 9.00-9.70, forming short-term support;
EMA7 golden crosses EMA13, K-line has a desire to rebound, but is facing EMA20 resistance;
MACD golden cross is about to form, green bars are significantly shortening;
BOLL lower track support is effective, but the middle track (10.7) pressure is obvious.
Conclusion: The four-hour chart is expected to build a rebound platform, with short-term rebound resistance looking towards 10.3-10.7, and rebound opportunities should not be ignored.

One-hour chart: Short-term long and short are stuck, waiting for a directional breakthrough
Price is consolidating in a small range of 9.4-9.8, forming a small box;
The EMA system is flat, and the short-term downward momentum has been almost exhausted;
MACD is about to golden cross, but the volume support is slightly insufficient;
RSI has rebounded from an extreme low to around 35, indicating that bulls are gradually regaining control;
BOLL band is extremely tight, indicating that a volume change is about to occur.
Conclusion: The one-hour chart is building a momentum platform. If it breaks through 9.85 in the short term, the rebound market is expected to unfold quickly.
Operation suggestion | June 6 TRUMP strategy
Type Point (USDT) Technical Logic
Opening position: 9.79
First Zhi Ying: 9.95
Second Zhi Ying: 10.09
Zhi loss position: 9.64


