The key watershed for the 4-hour level is 105070, the long and short strategy breakdown is as follows:
- Hold steady above 105070:
Short-term pullbacks are a normal correction, after minor retracements (such as 105300-105100) it may continue to rise. Pay attention to the pressure levels above:
- 106635 (first resistance level of the day);
- 107740 (previous high resistance at the 4-hour level);
- 108850 (key resistance zone at the daily level).
Breaking through 108850 could see a rise up to the 110000 integer level.
- Breaking below 105070:
The 4-hour rebound structure has failed, the market is turning to pullback, with layered support levels below:
- 103940 (first support level of the day);
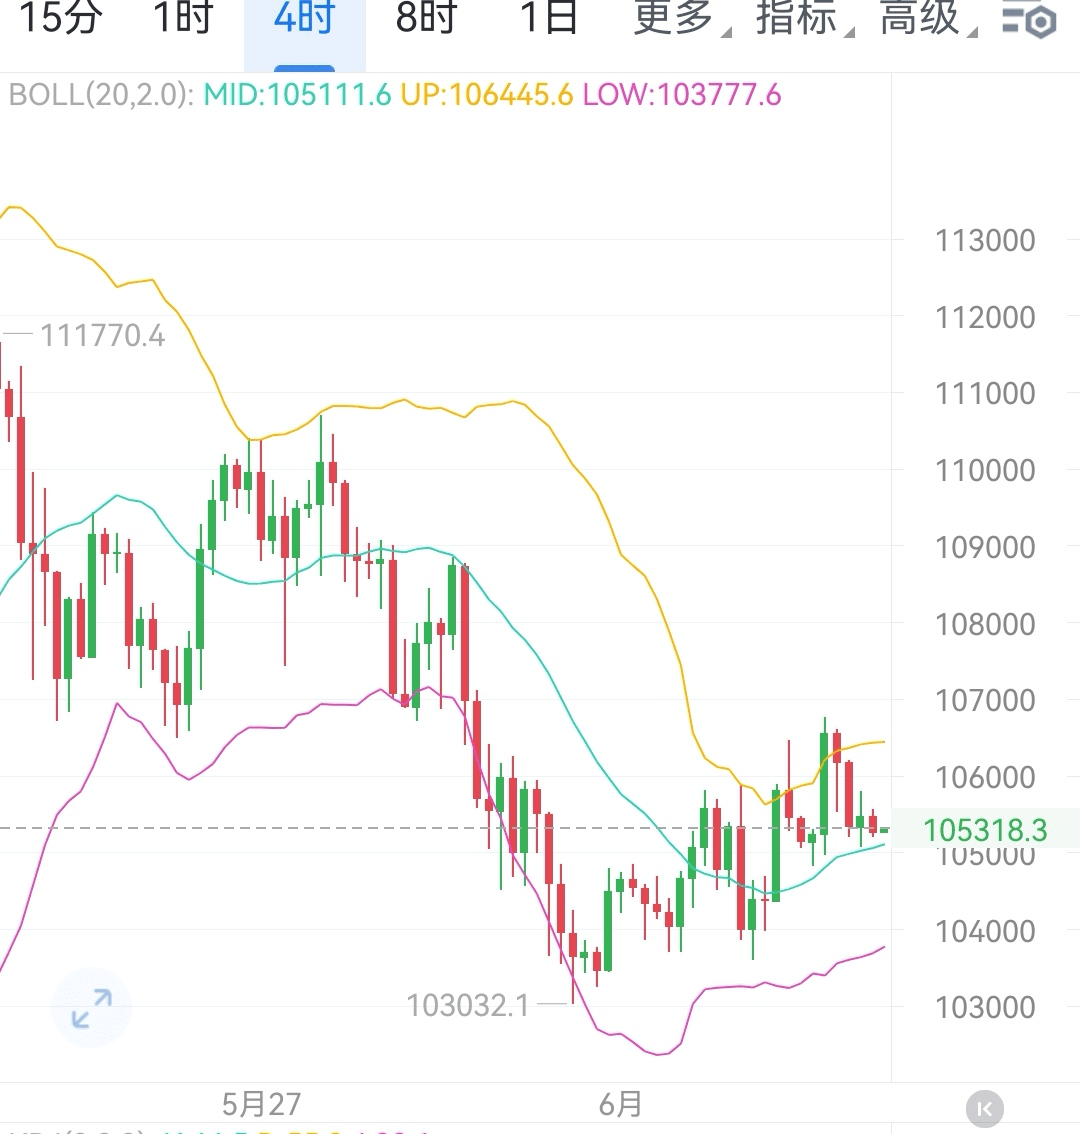
- 103030 (support at the lower Bollinger Band on the 4-hour chart);
- 102050 (strong support zone at the daily level).
If it falls below 102050, the pullback space may extend to around 100000.
Summary: 105070 is the short-term dividing line for strength between long and short positions. If it holds, bulls are favored; if it breaks, it triggers a pullback. It is advised to use this point as an anchor, if it retraces and does not break, a light long position can be attempted (target 106635), if it breaks, look to short (target 103940), be sure to set stop losses (300-500 points above and below the watershed), to avoid chasing highs and selling lows. $BTC