25/06/04 BTC decline has not yet ended, the rebound tests the support and resistance switch, patiently waiting for value lowland
The decline of Bitcoin has not yet ended, the rebound tests the support and resistance switch position at 107000, the daily strong sell combination plus the evening star indicates that breaking below the support of 107000 currently turns the rebound into pressure, there is still not enough time and space, and a downward wave three still exists.
Ethereum has maintained a high-level oscillation, with the weekly chart showing a throwback pattern, continuing to look bullish. Daily support is at 2300, and buying in batches near this area is advisable, as there may be a chance of a spike.
The current performance of the U.S. stock market is indeed quite tangled, having oscillated in a narrow range for over ten days, and there are only a few points left to the previous high, completing the harmonic pattern at 0.886 and continuing to rebound. Pay attention to the continuous analysis of the U.S. stock market by Mr. Gongzi, and it is important to note the lagging impact of tariffs; an economic recession is inevitable, so it remains to be seen whether the impact of tariffs will trigger this thunder.
Bitcoin
After a false breakout on the daily chart, it fell back, the upward trend has broken, currently still in a weak correction, the four-hour chart has formed an upward channel, currently below the resistance level of 107000 which is the support and resistance switch, given the strong performance of the U.S. stock market, plus the news that Lee Jae-myung was elected president, previously Lee Jae-myung promised to push for the approval of cryptocurrency ETFs and proposed to issue a stablecoin based on the Korean won, so in the short term, we need to pay attention to the impact of news.
The CME gap is between 96000 and 98000, and the false breakout decline is also around 98000. Today’s rebound touched the middle track of the Bollinger Bands and faced pressure, 100000 is also a key support level, both of these places can be bought in batches.
Support: 96000—98000—100000
Pressure: 107000—110000—112000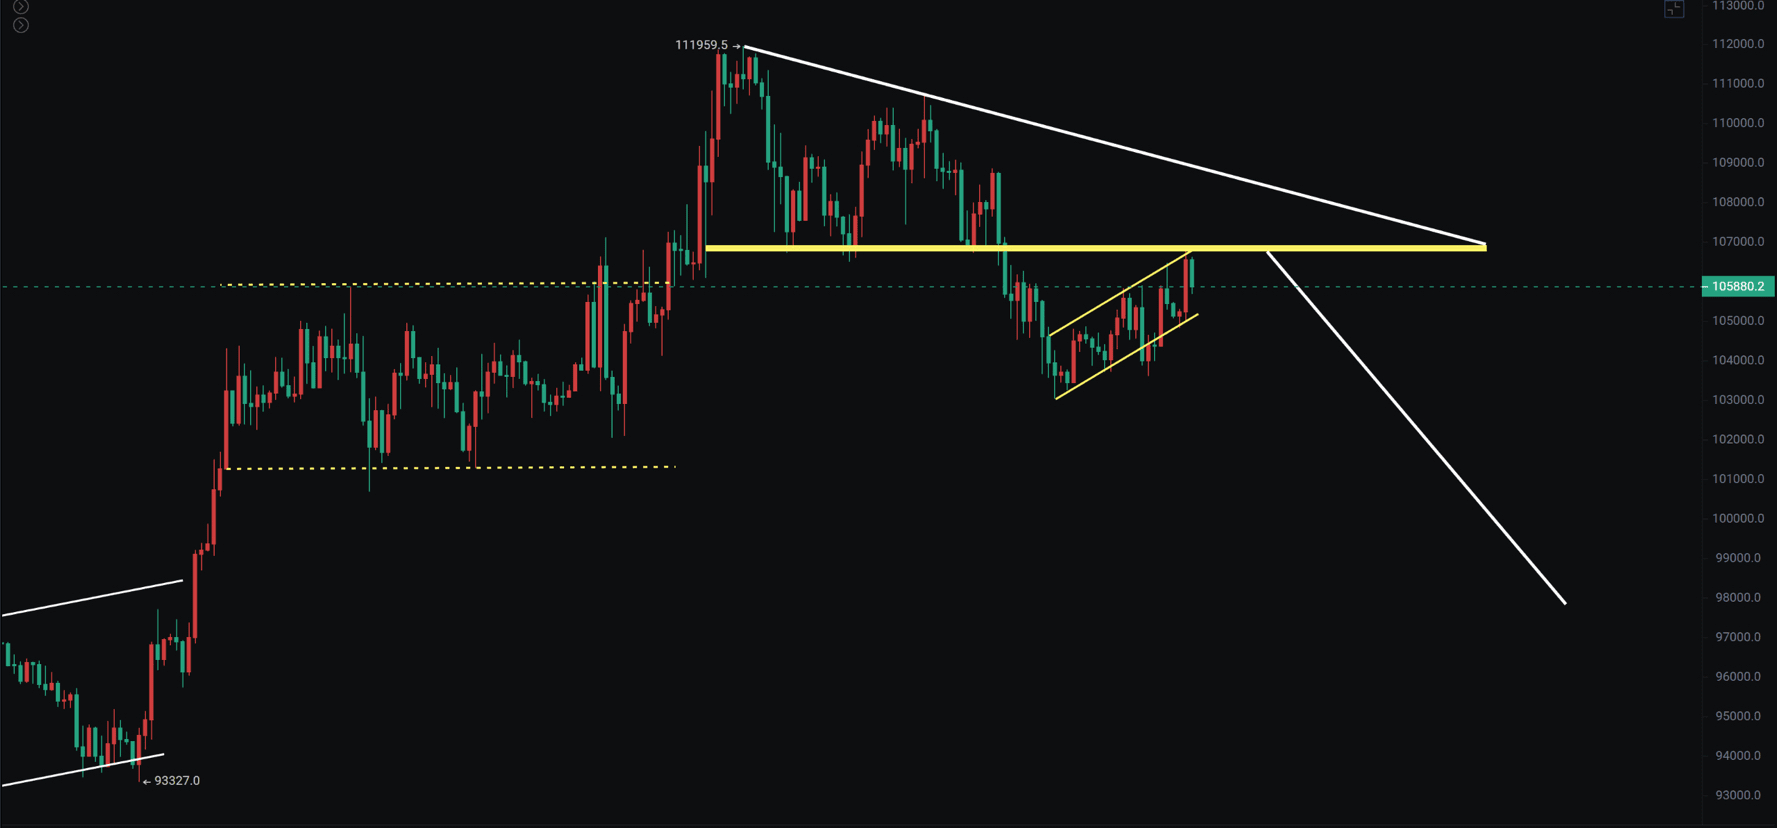
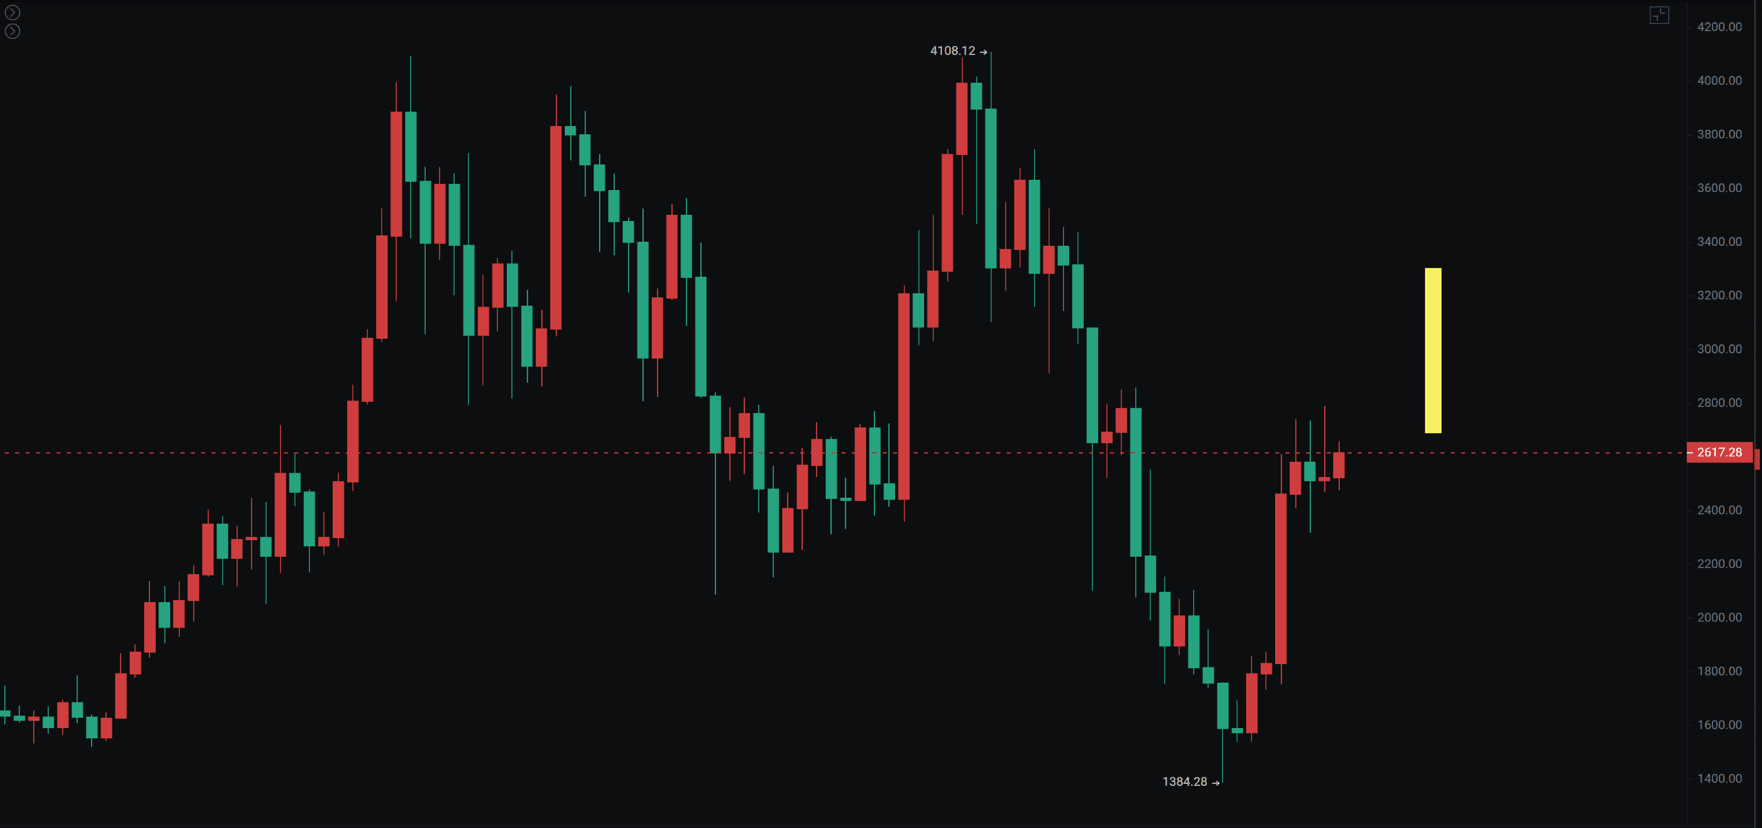
Ethereum
The weekly chart showing a throwback pattern is a bullish signal, this wave has adjusted well with Bitcoin, providing an opportunity for a large bullish candle pointing to 3300.
The daily chart has been volatile for more than half a month, still between 2300 and 2800. 2800 serves as a crucial dividing line between bull and bear, still in effect, and from the weekly perspective, Ethereum does not rule out a large-scale oscillation, and once it breaks through 2800 to 3300, there is a possibility to reach 4000.
Support: 2100—2200—2300
Pressure: 2800—3300—4100