The market has been frequently volatile in the past two days. #BTC has declined about 4% from its high, having touched the previously consolidated first support level and rebounded slightly, but there is still a significant divergence. Although it has stayed above the 5-day moving average in the 4-hour to 24-hour cycles, it continues to fluctuate along the line, making it difficult to open up upward space, and altcoins are hesitant to follow suit.

A few days ago, #ETH surged strongly, and the E-guardians were full of energy, but this was actually a typical false breakout. Fortunately, a short position was chosen at that time. From the cyclical pattern, 2800 was not effectively broken, meaning it's hard to push up to 4000. If it can't go up, it will naturally seek lower levels. The support below is around 2118, and it's recommended to place spot orders in batches in the range of 2250-2118-2000.
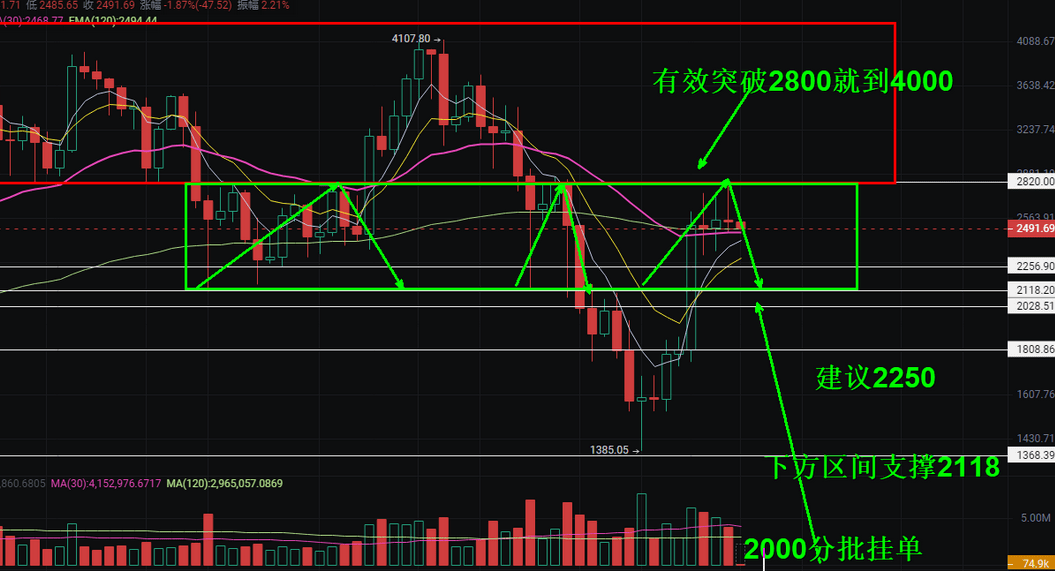
Currently, the focus is still on shorting during rebounds. The weekly chart has shown long upper shadows for several weeks, indicating that large amounts of capital have fled above 2500, creating obvious pressure.
In contrast, many #altcoins have fallen back to their starting points, reflecting that the current altcoin risk is much higher than before, necessitating heightened vigilance. Overall, going long requires courage and patience, while shorting is relatively easier.
On a macro level, market sentiment is cautious. On one hand, the expectation of interest rate cuts in June has weakened, and on the other hand, the incident of Ukrainian drone strikes on Russian military airports has escalated geopolitical tensions again, increasing uncertainty in the short term. In the absence of clear upward signals, the market is in an adjustment phase, which is typically a stage where short selling is more advantageous.
Returning to market dynamics!
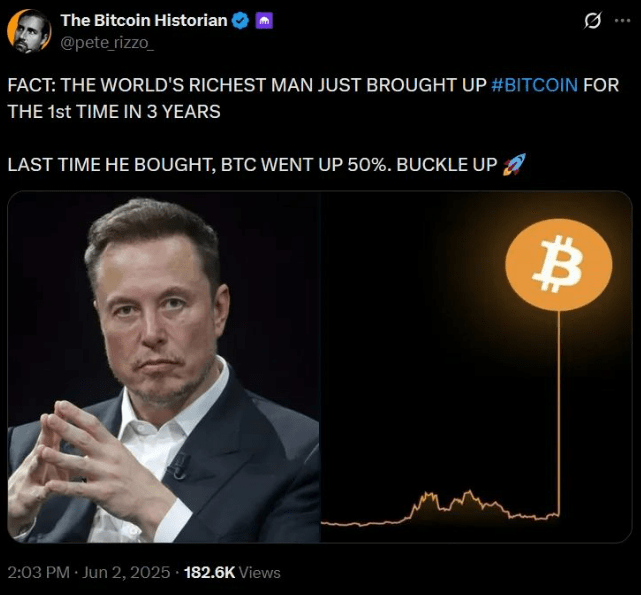
After three years, Musk mentioned Bitcoin again! How will the market develop?
Observing the price movements of $CA and on-chain data over the past two days shows that the recent decline is mainly due to large holders who FOMOed in near 0.02 choosing to cut losses and exit. Below 0.01, there has been a significant number of new addresses continuously building positions, indicating that new funds are accumulating at low levels.

Today, with the public announcement of the #WLFI event, the price of $CA quickly rebounded to around 0.01, which basically indicates that the accumulation and washout phase is nearing its end.
Having covered the key points, let's look at a few altcoin trends.
SUI
From the daily chart perspective, after breaking through the bearish flag pattern, the price quickly surged by 16.28%, reaching a high of 4.04. It is currently fluctuating in the range of 3.2 to 3.3, waiting to confirm whether it can break through the resistance level of 4.09. If successful, it could aim for 4.35. However, if it faces pressure and falls back, it could drop to 3 in the short term. The current fluctuation range is a high of 4.35 and a low of 3, with an average price of about 4.00.

In the medium to long term, Sui Network plans to unlock tokens worth 320 million by the end of 2025. If the bullish sentiment continues, #SUI is expected to reach a historical high, with a target price of 7.01; if there is a period of adjustment, the low point may be around 3.84, with the average price expected to be 5.42 in 2025.
BNB
Binance Coin (#BNB) is currently trading at approximately 653.09. Previously, it experienced a pullback after a bullish surge on the daily chart and is still hovering near the overbought area. The short-term key resistance level is at 707.25; if successfully broken, it could further rise to 730.52, or even challenge a new high of 801.25. The formation of a golden cross, the trading volume on the BSC chain exceeding 100 billion, and upgrades such as Pascal, Lorentz, and Maxwell all provide strong support for BNB to create a new ATH.

Looking ahead to 2025, with the much-anticipated altcoin season approaching and the Binance ecosystem continuously expanding, BNB is expected to challenge the 1,000 mark. If the upward trend continues, its price may reach a maximum of 1,292 USD, while it could drop to a minimum of 761, with an expected average price of around 926 for the year.
TRX
The daily chart shows that its price is in a consolidation phase, forming strong support around 0.27. If it can maintain this area and start to rebound, it is expected to surge to 0.2979 in the short term, further challenging the key level of 0.3. However, the current RSI is at 66.08, indicating a possible technical correction may occur first. If the trend weakens, #TRX may fall back to the support level of 0.2443. From a fundamental perspective, the growth of the DeFi ecosystem and the introduction of gasless transactions provide support for price increases. Additionally, the moving average of daily trading numbers over the past 30 days has surged by 95%, reaching about 8.4 million transactions, indicating a significant increase in activity.

Looking to the future, in an optimistic scenario, TRX is expected to remain above the psychological level of 0.70 and test the volatility high of 0.73 USD; if it experiences a pullback, the price could drop to 0.39, with an expected average price of 0.56 USD for the year.
The article ends here! If you are confused in the crypto space, consider joining me in positioning and harvesting from the market makers.

