Yesterday's Review (June 1)
ETH showed a weak oscillation pattern yesterday, repeatedly failing to break 2580 during the day, falling back to around 2500 in the evening, overall maintaining a bearish oscillation trend. However, from a structural perspective, there has been no sustained volume decline, indicating a weakening of bearish momentum, more likely a washout-style consolidation rather than a trend reversal.
Multi-timeframe Technical Analysis (June 2, 2025)
Daily level: middle track support, pullback has not broken.
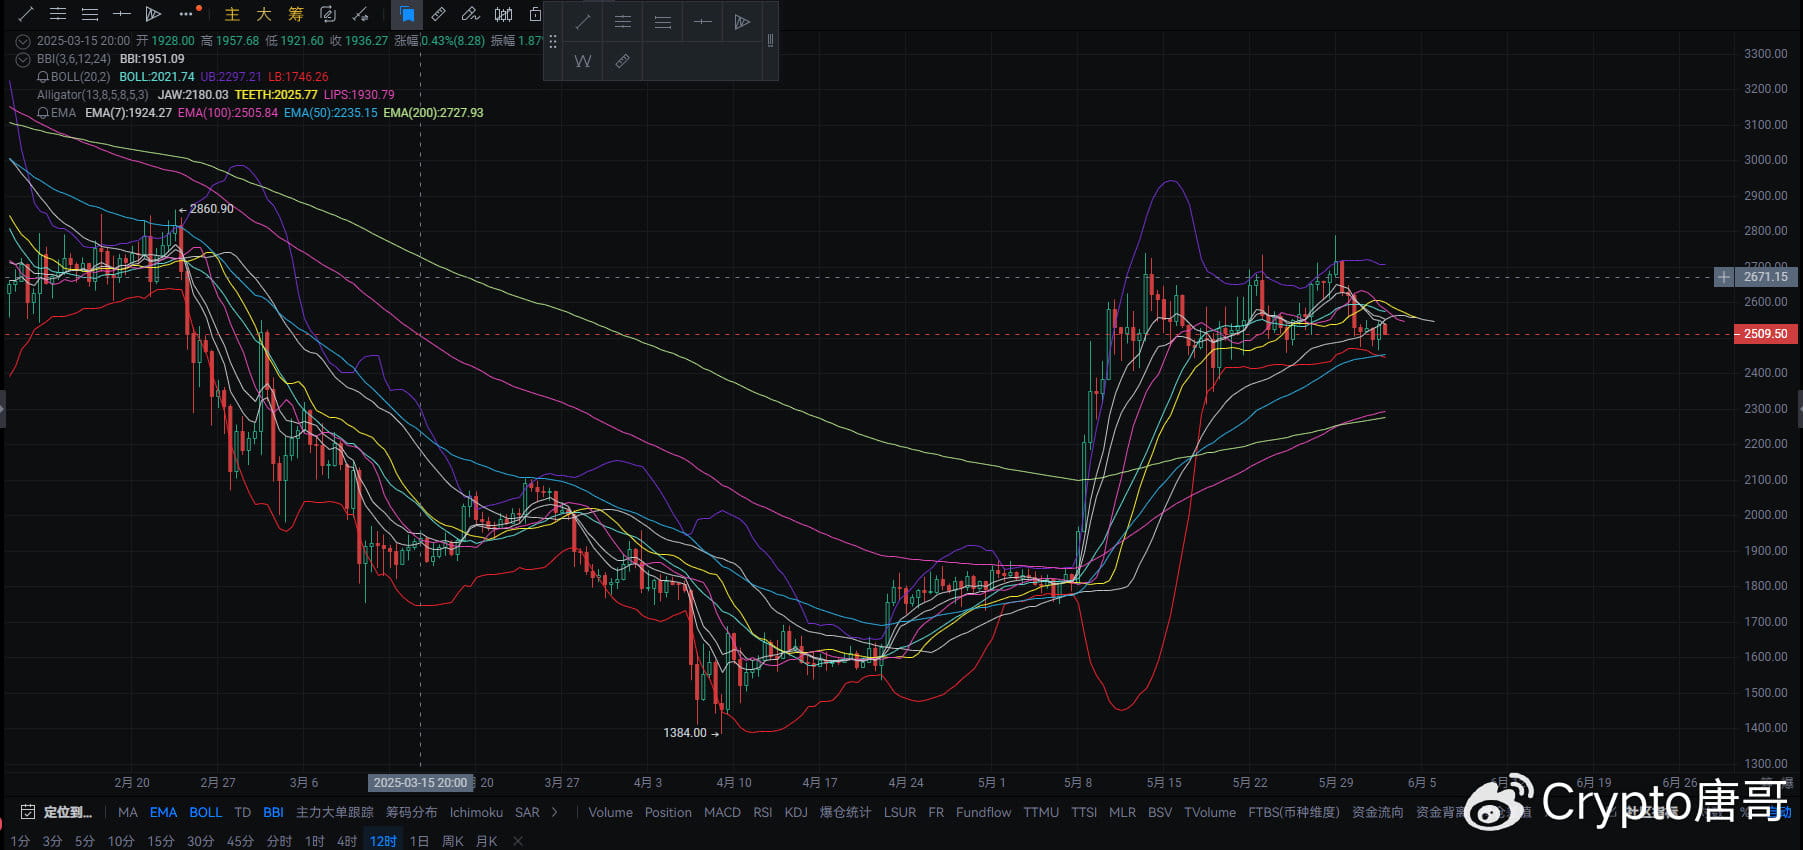
Yesterday's closing price: 2485.94 USDT, daily K line has a small bearish candle with a lower shadow;
BOLL middle track support is near 2453, not effectively broken;
EMA20 (2524) and EMA50 (2208) are still in a bullish arrangement, the current K line is running between EMA7 and EMA20;
Although MACD has a death cross at a high position, the green bars are diminishing, and momentum release is nearing its end;
RSI is at 49, in the critical oscillation zone, not yet entering the downtrend zone.
Conclusion: The daily structure is still in a strong support zone, pullbacks are reasonable, and if it holds above 2453, it will welcome a corrective rise.

Four-hour chart: oscillating triangle, direction is about to be chosen.
Prices have recently fluctuated between 2550 and 2480, forming a clear converging triangle pattern;
EMA moving average system is intertwined, a typical accumulation oscillation pattern;
MACD double lines are close to the zero axis, green bars continue to shrink, brewing directional breakout;
The K line has repeatedly stepped down to the 2480-2500 range without showing a volume breakdown, indicating strong support intervention signs.
Conclusion: The four-hour period is in the final stages of accumulation. If it can break through 2550 with volume, it will form a small breakout structure, aiming for 2640-2700.

One-hour chart: bottom structure is gradually forming.
After the price hits the bottom at 2500, multiple hammer candlesticks + bullish engulfing combinations appeared;
EMA7 and EMA20 are about to golden cross, with EMA100 and EMA200 maintaining an upward trend;
MACD low position golden cross, green bars turn red;
BOLL is contracting, the price is pulling back to the lower Bollinger band and starting to return to the middle band (target 2525);
RSI indicator has risen from 32 to 45, short-term oversold rebound has started.
Conclusion: The one-hour structure has short-term rebound momentum, which may drive the four-hour breakout of the upper structure.
[ETH Trading Suggestions | June 2 Strategy]
Type Point (USDT) Logic Support
Opening position: 2506.30
First Zhi Ying: 2548.63
Second Zhi Ying: 2584.64
Zhi loss position: 2472.74


