25/05/31 BTC monthly chart is about to close, the shark pattern has perfectly corrected, patiently waiting for the bottom-fishing opportunity.
Bitcoin has fallen back after breaking through for the second time. The monthly line is about to close, facing pressure from the upper Bollinger Band. The weekly line has touched the upper band twice, and the RSI indicator has turned down, so there is a high probability of a retracement to the middle Bollinger Band, which is around 94000—95000.
Ethereum's monthly chart has spiked to the middle Bollinger Band, and the weekly chart has formed a throwing bricks to attract jade pattern, with three consecutive weeks of doji candlesticks. This pattern signals a continued bullish outlook, with opportunities to reach the upper Bollinger Band, which is around 3300. However, it is also necessary to note that Bitcoin is currently in a correction, which will have a short-term correlation. After the correction, the bullish outlook continues.
Regarding the news, the appeal court in the beautiful country allows the tariffs imposed by the understanding king to continue temporarily. This series of tariff delays by the understanding king is essentially artificially puncturing the economic bubble, including why there has been a persistent effort to have Bitcoin as a national strategic reserve. Currently, the trend of de-dollarization globally is unstoppable, and Bitcoin is merely a tool to mitigate the impacts brought about by this.
Bitcoin
The daily upward trend has broken, and the shark pattern has completed with a bounce to 1.13 after hitting 0.886, but it has faced pressure again. Additionally, after the second breakout, it fell back from 110,000, indicating short-term continued correction momentum. After completing 0.886 in this wave, I have been reminding not to chase the rise; after the correction, positions can be built gradually. The daily MACD is continuously showing a top divergence, with the next key support at 100,000, as well as Fibonacci levels of 0.5 (92222) and 0.618 (96400).
Support: 92222—96400—100000
Resistance: 106000—110000—112000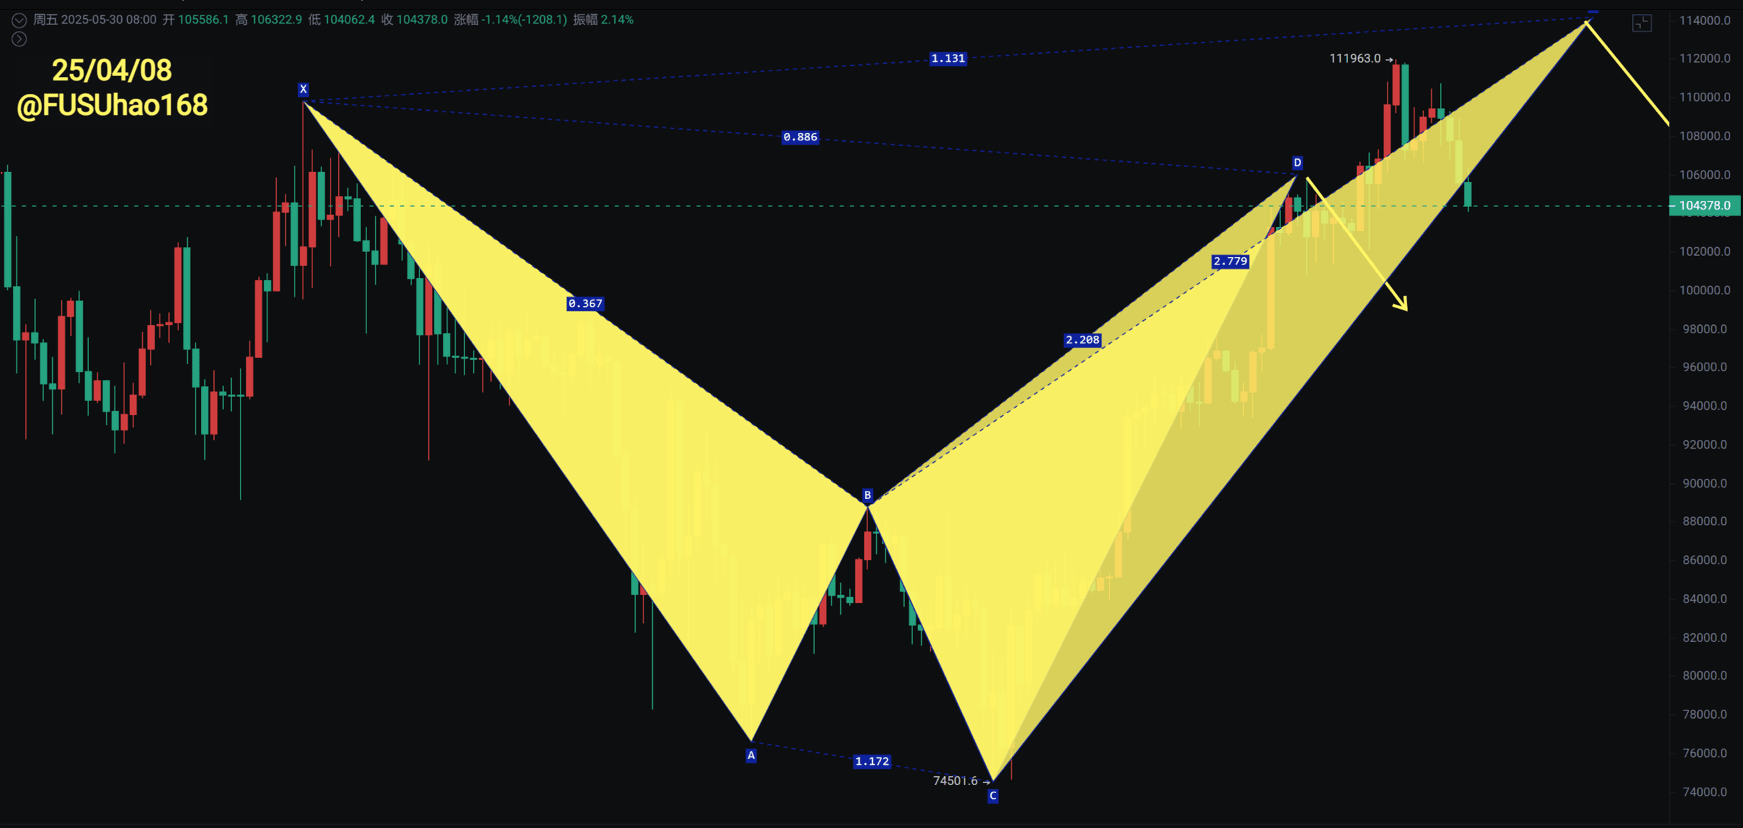
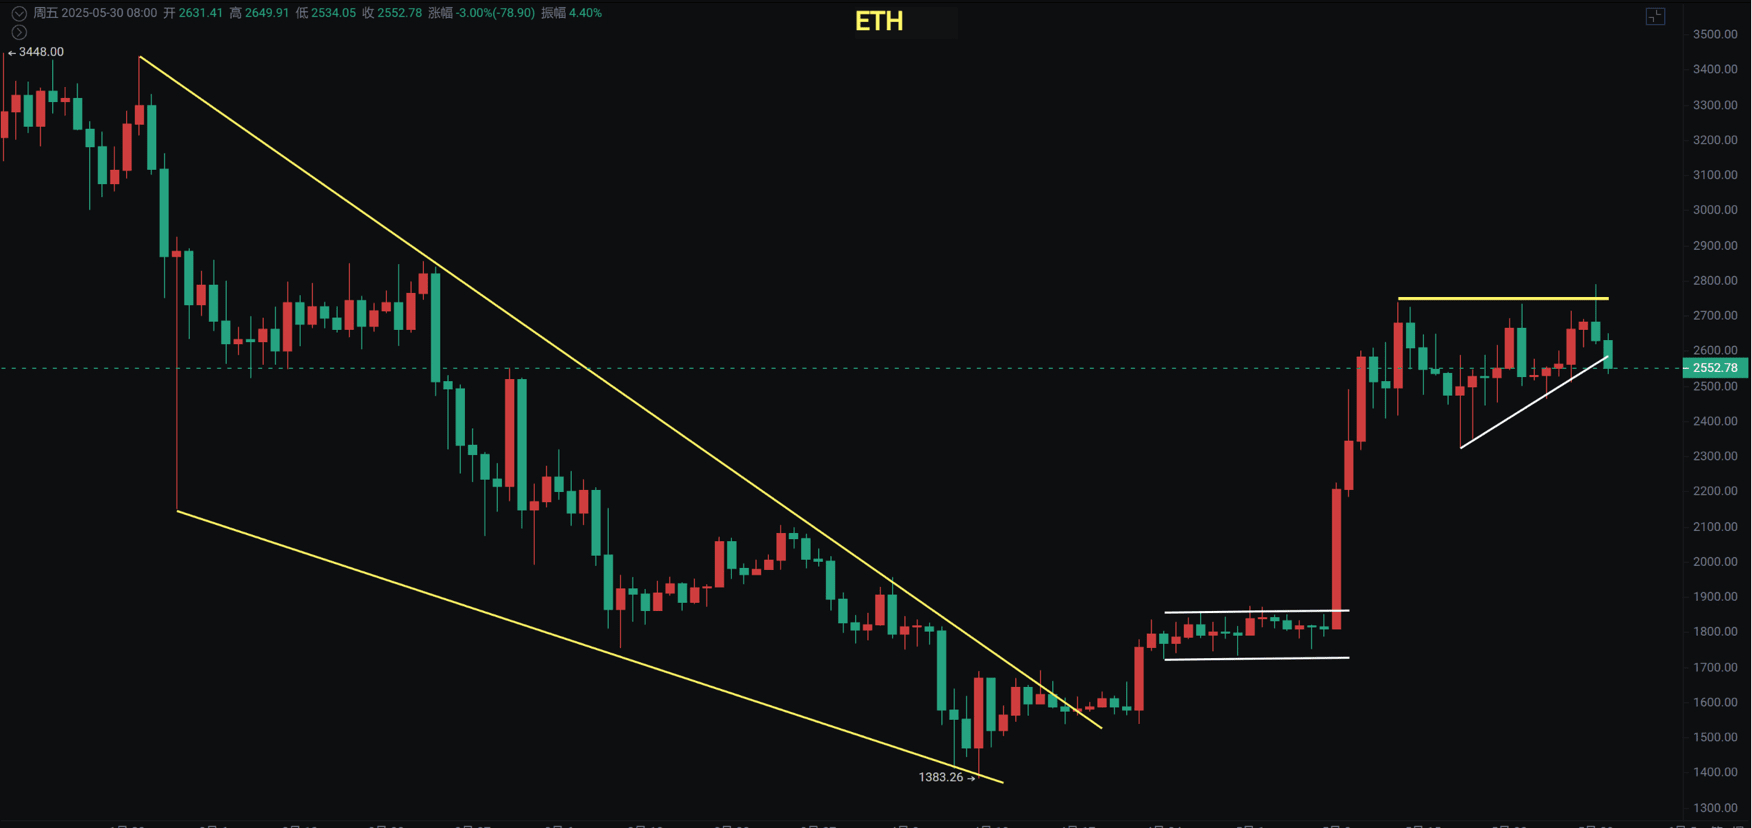
Ethereum
The Ethereum weekly chart has shown a pattern of throwing bricks to attract jade, with three doji candlesticks on the weekly chart. The daily chart has broken the daily high three times but fell back again. Currently, affected by the Bitcoin correction, there may be a short-term decline. The key support levels are 2300—2100, but a spike down to 2000 cannot be ruled out. Therefore, I personally suggest gradually increasing positions; if extreme spikes occur, hitting 2000 is also possible.
Support: 2000—2100—2300
Resistance: 2788—2856—3300