On the road to coin trading, I have worked hard all the way from a small retail investor with 5,000 yuan, and finally counterattacked into a middle class with 25 million! Let me tell you from my own personal experience: two methods!

The first type:
Only three 10x gains are needed to earn 10 million.
First, a basic theorem: In one's life, you only need to continuously all-in on three ten-fold coins to achieve lying down.
The first step is to prepare 10,000 yuan.
10,000-100,000
100,000-1,000,000
1,000,000-10,000,000
Decompose 10 million into 3 10x gains, find opportunities of corresponding magnitude in the first, second, and third 10x gains, and make money in each 10x gain.
Repeat the operation 100 times, and 10 million can basically be achieved.
Of course, this is also suitable for earning 1 million, or even 100 million. The underlying methodology is the same.
So your next task is to find 3 10x coins.
The second type:
In the crypto circle, you have to find a way to earn 1 million in principal first, and there is only one way to earn 1 million in principal from tens of thousands of yuan, that is, rolling positions. When you have 1 million in principal, you will find that your whole life seems to be different. Even if you don't use leverage, a 20% increase in spot will give you 200,000, which is already the income ceiling for most people in a year.
And when you can grow from tens of thousands to 1 million, you can also grasp some ideas and logic for making big money. At this point, your mentality is also much calmer, and the future is just copy and paste.
Don't always think of millions or hundreds of millions. Start from your own actual situation. Always bragging only makes the cow comfortable. Trading must have the ability to identify the size of opportunities. You can't always trade with light positions or always trade with heavy positions. Usually, just play with small guns. When a big opportunity comes, pull out his mother's Italian cannon.
For example, rolling positions, this can only be operated when a big opportunity comes. You can't always roll. It doesn't matter if you miss it, because you only need to successfully roll three or four times in your life to go from 0 to tens of millions. Tens of millions is enough for an ordinary person to advance to the ranks of the rich.
A few things to pay attention to when rolling positions:
1. Enough patience, the profit of rolling positions is huge. As long as you can successfully roll a few times, you can earn at least tens of millions or hundreds of millions. So you can't roll easily, you have to look for opportunities with high certainty;
2. Opportunities with high certainty refer to a sideways oscillation after a sharp drop, followed by an upward breakout. At this time, the probability of a trend is very high. Find the point where the trend reverses, and get on the train at the beginning.
3. Only roll long;
Rolling Position Risk
Let's talk about the rolling position strategy. Many people think this is risky. I can tell you that the risk is very low, far lower than the logic of opening positions in futures that you play.
If you only have 50,000, how do you start with 50,000? First of all, this 50,000 must be your profit. If you are still losing, don't read on.
If you open a position in Bitcoin + 10,000, set the leverage to 10x, use the segregated margin mode, and only open 10% of the position, which is only 5,000 yuan as a margin, this is actually equal to 1x leverage, and a 2-point stop loss. If you stop loss, you only lose 2%, only 2%? 1,000 yuan. How do those who burst their positions burst their positions? Even if you burst your position, okay, you only lose 5,000 yuan? How can you lose everything?
If you are right and Bitcoin rises to 11,000, you continue to open 10% of the total funds, and also set a 2% stop loss. If you stop loss, you still earn 8%. What is the risk? Isn't it said that the risk is very high? By analogy...
If Bitcoin rises to 15,000, and you successfully add positions, you should be able to earn around 200,000 from this 50% rally. Grasping two such rallies would amount to around 1 million.
There is no such thing as compound interest. 100x is earned by 2 times 10x, 3 times 5x, and 4 times 3x. It is not earned by daily or monthly compound interest of 10% or 20%. That is nonsense.
This content not only has operational logic, but also contains the core internal skills of trading, position management. As long as you understand position management, you cannot lose everything.
Enough nonsense!
Share my trading strategies and experiences with my friends. There is a saying that standing on the shoulders of giants can reduce the struggle by ten years. If you are lucky enough to see it,
Friends who want to improve their coin trading skills must read more, study carefully, and it is recommended to bookmark!
For traders who are new to the field of trading, they usually learn basic concepts such as support and resistance levels, moving averages, etc. Trend lines are often overlooked, but they can play a role in a variety of trading scenarios.
In this guide, you will learn the following:
(1) What are trend lines and how to accurately identify them?
(2) Why are not all trend lines equally important, and what coping strategies can you take?
(3) Three different types of trend lines that every trader should master;
(4) How to use the market dynamics revealed by different types of trend lines to trade and profit.
2. What is a trend line and how to identify it?
A trend line is a technical trading tool that helps traders identify potentially valuable price areas in market trends, as shown in the figure below.

If the market price touches a specific trend line area multiple times, there is a high probability that the price will rebound again in the resistance area formed by the trend line, as shown in the figure below.

Obviously, I am referring to a valuable area, not just a simple line, as shown in the figure below.

So, why view a trend line as an area rather than a single line? Doing so solves a common problem that general traders often encounter when applying trend lines. For example, should the trend line be drawn like this, as shown in the figure below.

This doesn't seem accurate. Then, how about this way, as shown in the figure below.

This still doesn't seem to meet the requirements. Let's draw it in the form of an area, as shown in the figure below.

That's correct. You can see that when we conceptualize a trend line as an area, we can comprehensively consider all historical data and market volatility. Not only that, this method also provides more accurate information to help you determine "when" to intervene in the trend pullback to capture the trend, as shown in the figure below.

Now that you have a deeper understanding of the concept of trend lines and how to draw them, the next question is, how to apply this tool. If you cannot master how to use trend lines in the market to make profits, then simply knowing how to analyze trend lines is of no practical significance. Before delving into this, it is necessary to discuss the purpose of using trend lines and why we need to use different types of trend lines as support.
3. Different Types of Trends
As you may have realized, trends in the market are not constant, so if the trends are not exactly the same, it indicates that the methods for drawing different types of trend lines are also different. Therefore, it is necessary for you to be familiar with the following three types of trends: strong trends, robust trends, and weak trends.
(1) Strong Trend
First, I need to clarify a point: Strong trends usually do not last. These types of trends have a dual nature. The speed of losing money may be as fast as the speed of making money, as shown in the figure below.

There are many tools and indicators used to define these types of trends. However, they all have a common feature: In a short period of time, the price shows a strong upward momentum, and the lows on the chart show a gradual upward trend, as shown in the figure below.

In short, a strong trend is like a sprinter whose goal is to reach the finish line as quickly as possible. The disadvantage is that they will soon run out of energy and need to rest. The same is true for strong trends. Next, let's discuss the characteristics of robust trends.
(2) Robust Trend
These types of trends happen to be my personal favorites because they are usually more durable than strong trends, as shown in the figure below.

You might be wondering why this type of trend is called robust. This is because the trend achieves a proper balance between breakouts and pullbacks, as shown in the figure below.

If a strong trend is like a sprinter, then a robust trend is like a jogger, moving forward at a steady and sustained speed.
(3) Weak Trend
In contrast, a weak trend is like a lost traveler hesitating in the process of trying to reach their destination, as shown in the figure below.

From an overall perspective, the market is still in a downward trend. However, as you can see, this trend includes many different trends and price ranges, as shown in the figure below.

This is similar to a lost traveler unconsciously spending time exploring "side" destinations while heading towards their main destination. This type of market often presents the greatest challenges for traders. Nevertheless, a significant characteristic of a weak trend is a long pullback period and a limited range of price breakouts.
Given that there are different types of trends, you should now be able to accurately grasp how to use different types of trend lines for trading. So, you may want to know what different types of trend lines there are. They include: straight trend lines, curved trend lines, and reversal trend lines. Next, let's delve into the core content of this guide and learn how to use these different types of trend lines to accurately enter, manage, and exit your trades.
4. Types of Trend Lines: Straight Trend Lines
(1) When are straight trend lines effective?
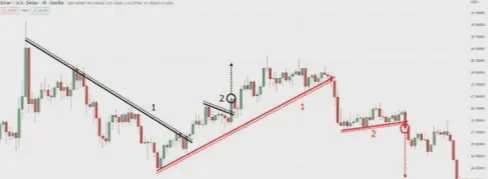
Straight trend lines are valid on the second swing high (or swing low), as shown in the figure below.

If trading decisions are only based on fluctuations in a single high or low point, then arbitrarily drawing trend lines from different angles will lose its meaning. Always remember to view trend lines as an area, not a single line, as shown in the figure below.

Different categories of trends correspondingly require the use of different categories of trend lines.
(2) What market conditions are the greatest advantage of straight trend lines?
The answer is undoubtedly a robust trend, as shown in the figure below.

Given the relatively frequent breakouts and pullbacks in robust trends, it is easier to draw and trade using straight trend lines. However, it is worth noting that market trends are not the same in all cases. So, how would you respond to the application of straight trend lines when the market shows the characteristics shown in the figure below.

You can't draw trend lines like this, as shown in the figure below.

Next, I will introduce you to the solution.
5. Types of Trend Lines: Curved Trend Lines
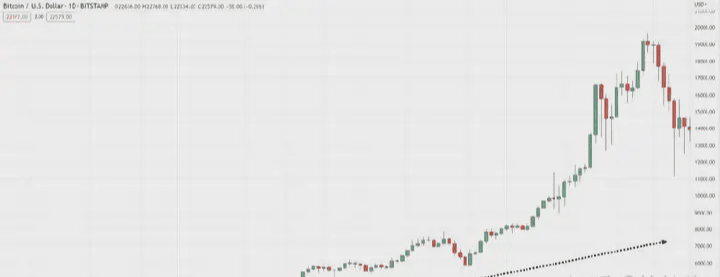
Do you remember the era when cryptocurrencies frequently occupied the news headlines? At that time, the trading world ushered in a new fashion. For some people, this was the motivation for them to enter the field of trading. Just when cryptocurrencies such as Bitcoin began to appear widely in news reports, they may have actually reached their price peaks, as shown in the figure below.

Many people worry about missing opportunities, and most investors enter at the top of the market (the consequences can be imagined). However, by using curved trend lines, you can: identify specific valuable areas for trading, clearly stay on the sidelines when the trend presents a parabolic movement, and exit the market when the trend inclination exceeds 80 degrees, as shown in the figure below.
Adopting a curved trend line in a parabolic trend can objectively indicate when you can take advantage of this significant trend, which is why a curved trend line is a valuable technical analysis tool worth including in your trading toolkit.
(1) When are curved trend lines effective?
This can be somewhat complex. We cannot determine whether this is forming a parabolic trend (given the market's continued inclination) until we observe the market's second test of the swing low, as shown in the figure below.

The reason why the curved trend line works during the second breakout is because of this, as shown in the figure below.

In the following content, I will explain to you how to use curved trend lines at the right time to enter and exit your trades.
(2) What market conditions are the greatest advantage of curved trend lines?
The answer is undoubtedly a strong trend, as shown in the figure below.
The reason I reveal this to you is that strong trends are often market conditions that easily manipulate your emotions (greed and fear). At the same time, this trend may confuse novice traders. They may ask the following questions: When can I enter this parabolic trend? Should I enter the market immediately now? I have recently entered the market, when should I exit? This is why curved trend lines have become one of the tools to help you objectively use this type of trend. Therefore, at the current stage, trend lines should be used together with the trend market, but you can also use trend lines to judge the timing of market reversals, so as to detect changes in market trends in advance.
6. Types of Trend Lines: Reversal Trend Lines
In the long course of trading, I have found that reversal trend lines are an extremely reliable method for detecting market reversals, which is similar to the process of drawing straight trend lines. However, the key is that you need to use them in the opposite way, as shown in the figure below.

At this moment, you may have a question in your mind, if the price breaks through the straight trend line, should I immediately regard it as a reversal trend line? What is the difference between a straight trend line and a curved trend line? These are all very insightful questions. Therefore, let me explain it to you in detail.
(1) When are curved trend lines effective?
Before showing you the relevant charts, let me show you an example of when a curved trend line is effective, as shown in the figure below.

This includes two elements, a standard straight trend line and a confirmation line, as shown in the figure below.

Therefore, when the market closes with strong momentum and falls below the confirmation line, as shown in the figure below.

Reversal trend lines become effective, and two things must also happen:
1) The price must break through the straight trend line, as shown in the figure below.

2) The price must pull back and then break through, as shown in the figure below.

In short, a reversal trend line is a continuation after a straight or curved trend line fails.
(2) What Market Conditions Are the Greatest Advantage of Reversal Trend Lines?
Reversal trend lines are usually an effective tool for finding trading opportunities in weak trend markets, because instead of waiting for the market to retest the trend line, as shown in the figure below.

Why not take advantage of market trend fluctuations, as shown in the figure below.
The main reason I introduce you to reversal trend lines is that even if the trend fails, you can still find trading opportunities. So, let's put everything together and show you: when you should enter the market, how you should manage risk, when you should exit the market, and how to use different types of trend lines.
7. How to Profit from Different Types of Trend Lines
Why do you need to first identify different types of trends? This is because we need to know which different types of trend lines should be used. Why do you need to identify different types of trend lines? This is because we need to know what type of trading strategy and risk management should be used. Everything is interconnected.
(1) Straight Trend
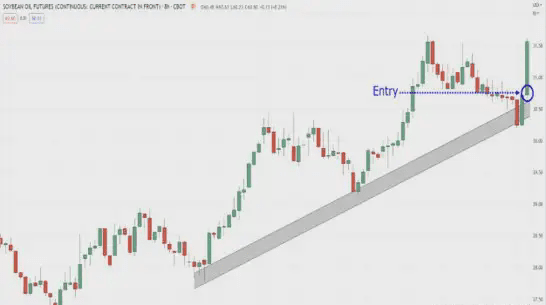
Using straight trend lines in robust trends is an ideal time to capture pullback opportunities. You may want to know what a pullback is. See the following example, as shown in the figure below.

Therefore, when your straight trend line is effective (this is after the second test of the swing low), as shown in the figure below.

You will wait for the price to retest the third swing low. This is a relatively simple step. Then, what should you do when the price retests the swing low? What signs do you want to see before executing a trade? First, you need to observe whether the price closes inside or outside the trend line, as shown in the figure below.

Then, once the price closes and returns to that range in a strong candlestick form, as shown in the figure below.

You will place a market order when the next candlestick opens, as shown in the figure below.
So, how to exit a trade? In this case, we will use a trailing stop, which is the trend line itself. This means that you want to end the trade when the price is below the trend line support area for two candles, as shown in the figure below.

(2) Curved Trend Lines
In previous trend lines, we entered the market through retracement setups. However, for strong trends, there are usually no significant retracements, as strong trends tend to continue to rise, as shown in the figure below.

So, what is the countermeasure? Adopt a breakthrough setup, as shown in the figure below.

Once your curved trend line becomes effective at the second breakout, as shown in the figure below.

You just need to enter when the next candle opens, as shown in the figure below.

The exit strategy is similar. You use the trend line as a reference for trailing stops, as shown in the figure below.

You may not be able to accurately predict the top of the market, so the profits gained in this trade may be limited. Ultimately, you cannot really determine when the top of the market will occur. Also, not every trade can bring significant profits.
(3) Reversal Trend Lines
As I pointed out earlier, this type of trend line is one of my personal favorite tools because it provides you with a "preview" of insights into new potential trends. The potential rewards are quite considerable, as shown in the figure below.

This is not a panacea strategy. There is always a possibility that the trend will fail to reverse (such as any trading setup I showed you earlier), as shown in the figure below.

But your entry strategy is similar to the curved trend line, also involving a breakout point, as shown in the figure below.

The only difference is that this time, we need a mid-term moving average as an auxiliary tool for trailing stops, such as a 50-week moving average. This means that you will only end the trade when the price exceeds the 50-day moving average with a closing price, as shown in the figure below.

Whether you choose a 40-period, 46-period, or 56-period moving average, it doesn't matter. Therefore, don't spend too much time looking for the "best" indicator because it doesn't exist. Any "mid-term" moving average period can meet the needs.
8. Disclaimer
In this guide, I have shown you a series of carefully selected charts designed to illustrate key concepts. However, the market sometimes makes your trading strategy ineffective (as other strategies may encounter). The following resources will provide support when you use different types of trend lines for trading:
(1) Comprehensive Guide to the ATR Indicator;
(2) Comprehensive Guide to Breakout Trading;
(3) Comprehensive Guide to Trend Line Trading;
(4) Moving Average Indicator Trading Strategy Guide.
These resources will help deepen your understanding of trend lines and other technical indicators, and improve your trading skills.
9. Conclusion
Here is an overview of the core points of this guide:
(1) Trend lines should be viewed as an area, not just a straight line on the chart, even though it is named a trend "line."
(2) There are different types of trends in the market, such as strong, robust, and weak.
(3) For robust trends, straight trend lines can be used; for strong trends, curved trend lines can be used; and for weak trends, reversal trend lines can be used.
(4) You can use pullbacks and breakouts as entry triggers for different types of trend lines, and use trend lines as exit triggers for trailing stops.
"What do you rely on to survive in the crypto circle?"
"A very stupid method, but very effective."
——This is my most honest answer after struggling in the crypto circle for several years.
This method is called the Pot Lid Top Reversal Strategy.
A technical form that sounds rustic and looks simple,
But it has saved me from the edge of losses time and time again, allowing me to survive and make money.
Today, I want to explain it thoroughly and also explain the "Tao" behind it.
Truly useful techniques are often the most simple.
In the crypto circle, there are too many complicated methods, indicators, forms, AI quantification, GPT strategies...
But the ones that make money are often the simplest and most effective methods.
"Pot Lid Top" is such a simple but highly practical form.
It has three core characteristics:
Trend is clear: It must be formed during an upward process and belongs to a top reversal signal;
Two peaks side by side: The two K-line high points are close, seemingly strong but without a breakthrough;
Negative line kills: Finally, a large negative line runs through the structure, forming the shape of a "lid"扣 down.
Why is it effective?
Because it is not some fancy combination of K-lines, but represents the shift in market will.
It tells us: The bulls don't want to push anymore, and the bears are starting to take the initiative.
In the language of the market, this "turning" is more real than any indicator.
The truth of trading: It's not complicated, but "clean and neat."
People who use the Pot Lid Top method are doing one thing:
"Find the top and leave."
Don't fantasize about a rebound, don't wait to get out of the trap,
No hesitation, no greed, no repeated verification.
Take action when you see a signal. This is the victory of discipline.
You will find that people who can truly make money in the crypto circle in the long term never pursue a 100% win rate.
But pursuing certainty and resting when there is ambiguity.
The moment the Pot Lid Top forms is a very strong signal of certainty.
What you have to do is not "wait and see," but: cut your losses, leave, and wait for the next opportunity.
Many people die from "waiting for a rebound" and die from "unwillingness,"
In fact, they all die from not believing in signals and believing in emotions.
The so-called "stupidest method" is often the closest to the truth of the market.
You will find a very ironic rule:
The more inexperienced and unskilled people are, the easier it is to make money using the Pot Lid Top.
Want to fight for doubling your account? Want to enjoy big gains? Want to successfully recover your losses?
Follow the rain closely and pre-position yourself in the main bull market wave!
Keep an eye on: TRB WCT NXPC