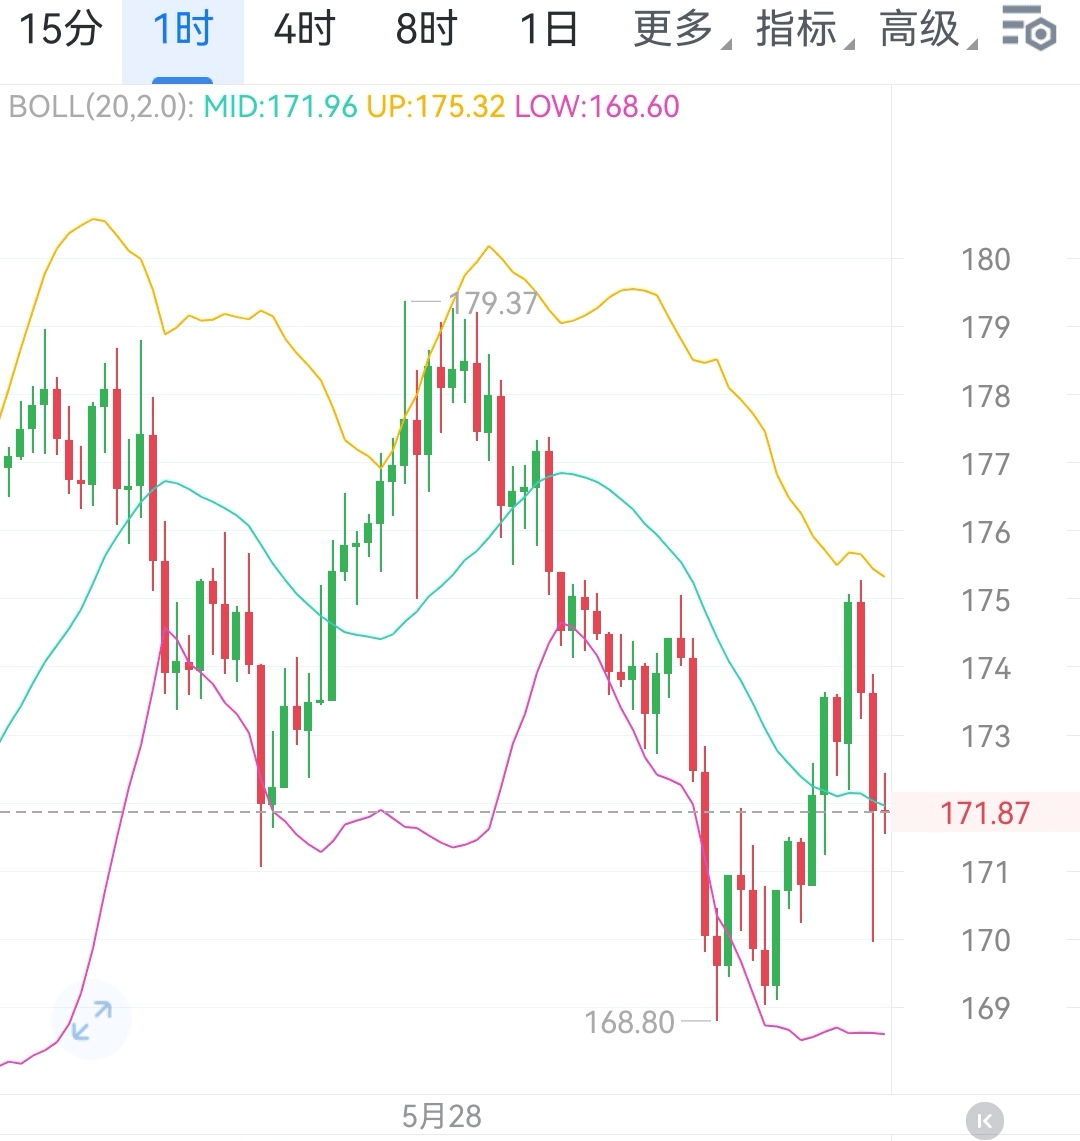
The trend of SOL shows a strong correlation with Bitcoin, and it is currently in a rebound phase on the 1-hour chart. The price level of 172 is a key observation point; if the 1-hour candlestick remains above 172, it indicates that the rebound trend has not yet ended, and it is likely to challenge higher price levels. Key resistance levels to watch above are 175, 177, and 179; if the closing price on the 1-hour chart effectively falls below 172, it means the current rebound has ended, and the market may enter a downward channel, with support levels at 169, 164, and 160 facing bearish pressure.
Summary: 172 is the key level for judging the direction of SOL's 1-hour trend. If the price stabilizes above this level, it indicates a bullish trend; if it falls below, it suggests a weakening trend. Traders can adjust their positions and trading strategies based on the actual dynamics between SOL and key levels, seizing opportunities and managing risks as trends change.$SOL #SOL走势