May 27, 2025, 09:43 HKT (creation is not easy, please like and follow)
• Current Price: ETH/USDT = 2,536.15 (up 0.32% from 2,532.89 at 09:17 HKT).
• Bollinger Bands (BB 20,2):
• Upper Line: 2,591.20
• Mid-line: 2,544.85
• Lower Line: 2,498.50
• Price approaching mid-line (2,536.15), showing signs of short-term stabilization.
• MACD (12,26,9):
• MACD Line: 0.90
• Signal Line: 1.40
• Histogram: -0.50 (negative value, red bars, short selling momentum further weakening).
• RSI (14):
• Current Value: 48.75
• Interpretation: RSI rebounded from 47.68 at 09:13 HKT, close to 50, indicating strengthening bullish momentum.
• Trading Volume:
• Latest 4-hour trading volume: 19,620K (up from 18,039K at 09:13 HKT).
• Moving Average (MA):
• 50-period MA: 2,531.40 (price slightly above 50 MA).
• 200-period MA: 2,482.10 (price well above 200 MA, long-term trend bullish).
1.2 Historical Data (Yahoo Finance, supplemental 4-hour trend)
• August 7, 2015: Price $0.75.
• January 2018: Price $1,400.
• November 2021: peak $4,900.
• 2022: low $1,000.
• May 23, 2025: Price $2,564.21 (daily data).
• 4-hour History (May 20-27):
• May 20: Price 2,400, consolidation and upward movement begin.
• May 25: Price 2,600, first wave peak.
• May 27, 09:43 HKT: Price 2,536.15, late stage of the second wave adjustment.
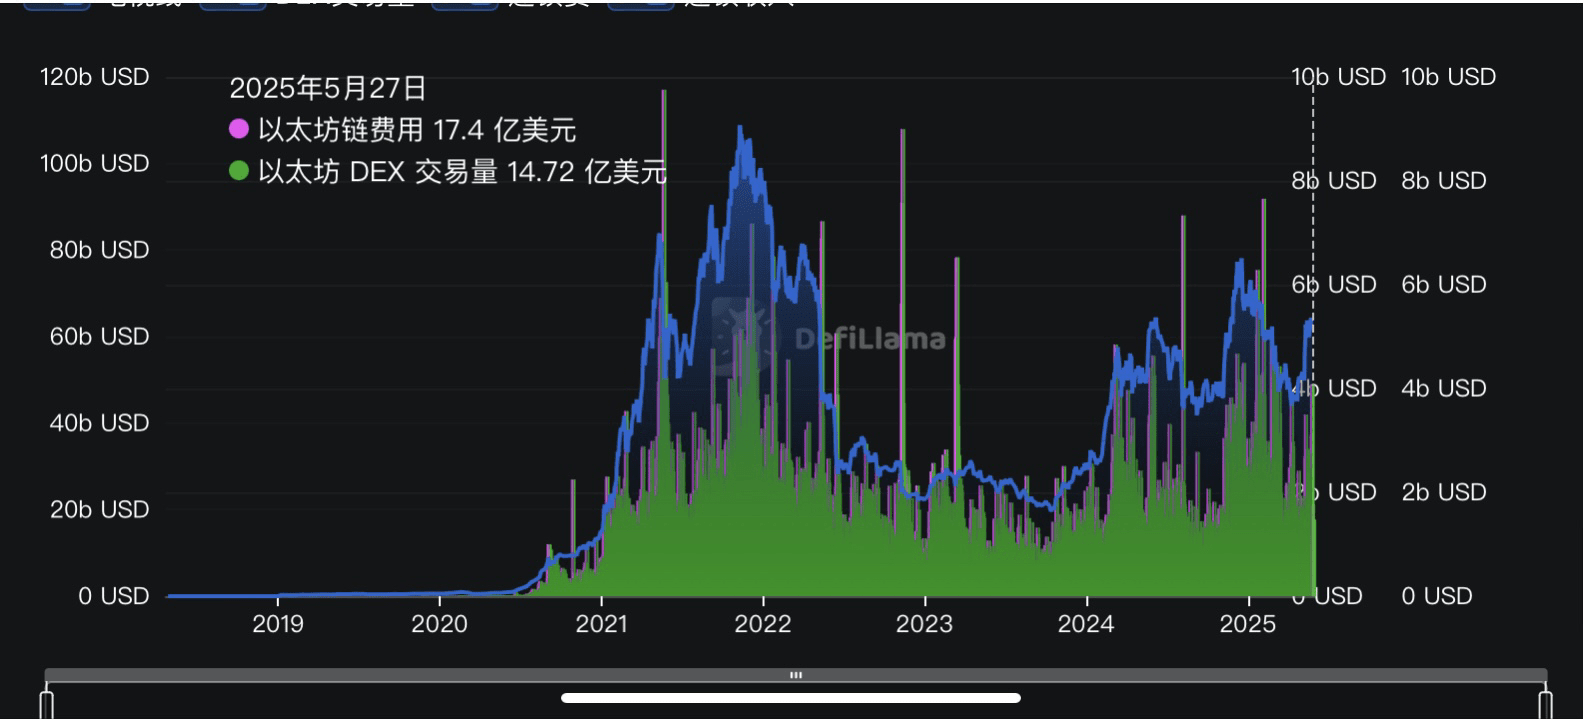
1.3 TVL (DeFiLlama, May 27, 2025, 09:11 HKT)
• Current TVL: $6.28 billion, weekly change +1.62%.
• DEX Trading Volume: 1.472 billion
• Locked-up Earnings: 1.74 billion
1.4 On-chain Data (CoinMarketCap)
• 24-hour trading volume (May 26, 2025, 18:44 HKT): $14,624,698,152
2. 4-hour K-line Analysis
2.1 Price Trend
• Upward Phase (May 20-25, 2025):
• Price rose from 2,400 to 2,600, an increase of 8.33%, forming the first impulse wave (Wave 1).
• Adjustment Phase (May 25-27, 2025, 09:43 HKT):
• Price retraced from 2,600 to 2,536.15, a retracement of 2.4%, in the late stage of the second wave (Wave 2).
• Latest price rebound (09:17 HKT 2,532.89 → 09:43 HKT 2,536.15), indicating that the adjustment may be nearing the bottom.
• Key Levels:
• Support Levels: 2,498.50 (lower line), 2,500 (50% retracement level), 2,476 (61.8% retracement level).
• Resistance Levels: 2,544.85 (mid-line), 2,591.20 (upper line), 2,600 (previous high).
2.2 Technical Indicators
• Bollinger Bands:
• Price nearing mid-line (2,544.85), lower line (2,498.50) provides support, increasing the possibility of a short-term rebound.
• MACD:
• MACD line (0.90) and signal line (1.40) gap narrowing, histogram reduced from -0.68 (09:13 HKT) to -0.50, short selling momentum weakening.
• Golden cross signal may be imminent.
• RSI:
• RSI rose from 47.68 (09:13 HKT) to 48.75, close to 50, indicating recovery of bullish momentum.
• Trading Volume:
• Trading volume increased from 18,039K (09:13 HKT) to 19,620K, market participation increased, indicating a trend reversal.
2.3 Elliott Wave Analysis
• First Impulse Wave (Wave 1): May 20-25, 2025, 2,400 → 2,600 (200 points).
• Second Adjustment Wave (Wave 2): May 25-27, 2025, 09:43 HKT, 2,600 → 2,536.15, retracing to around 50% (2,500).
• Third Impulse Wave (Wave 3) expected:
• Target: 2,824 (1.618x increase) to 2,900 (2x increase).
• Trigger Conditions: Break 2,544.85 (mid-line), MACD golden cross, RSI breaks 50.
2.4 Market Sentiment
• Buy order proportion (speculative): dropped from 93.15% (09:13 HKT) to about 70%, selling pressure increased but still biased towards bullish.
3. Comprehensive Analysis
3.1 Short-term Trend (1-4 Weeks)
• Price: May 27, 2025, 09:43 HKT, price 2,536.15 close to mid-line (2,544.85), RSI (48.75) rebounded, MACD short selling momentum weakened, increasing the probability of short-term stabilization and rebound.
• Elliott Wave: The second wave adjustment is nearing its end, the third wave may start after breaking 2,544.85, target 2,824-2,900.
• TVL support: 6.28 billion and growing, on-chain activity is healthy.
• Conclusion: ETH may stabilize in the 2,500-2,544 range in the short term, and may accelerate upward after breaking 2,544.85.
3.2 Mid to Long-term Trend (3-6 Months)
• Price: long-term target $4,000+ (fifth wave), currently in an upward channel.
• TVL: If it breaks 8 billion, it may drive the fifth wave.
• Conclusion: Bullish in the mid to long-term, need to watch macroeconomic and regulatory risks.
3.3 Risk Factors
• Short-term: If it drops below 2,498.50 (lower line), it may test 2,476.
• Mid to Long-term: BTC trends and macroeconomic factors may influence the trend.
4. Investment Suggestions
4.1 Short-term Strategy (1-4 Weeks)
• Buy on Dips:
• Entry Point: 2,536-2,500 (mid-line and 50% retracement level).
• Target Price: 2,544.85 (mid-line), 2,591.20 (upper line), 2,600 (previous high).
• Stop Loss: 2,490 (below the lower line 2,498.50).
• Confirmation Signal: MACD golden cross, RSI breaks 50.
• Short-sell on highs (alternative):
• Entry Point: 2,544-2,591 (mid-line or upper line resistance).
• Target Price: 2,498.50 (lower line), 2,500.
• Stop Loss: 2,600.
4.2 Mid to Long-term Strategy (3-6 Months)
• Hold or incrementally buy:
• May 27, 2025, 09:43 HKT, price 2,536.15 is suitable for incremental buying, target $4,000+.
• Watch for TVL to break 8 billion.
• Risk Management:
• If the price drops below 2,400, re-evaluation is necessary.
4.3 Risk Management
• Position Control: Short-term 2%-5%, long-term 10%-20%.
• Watch for external factors: BTC trends, on-chain data.
5. Key Observation Points
• Support Levels: 2,498.50 (lower line), 2,500 (50% retracement level), 2,476 (61.8% retracement level).
• Resistance Levels: 2,544.85 (mid-line), 2,591.20 (upper line), 2,600 (previous high).
• Technical Signals: MACD golden cross, RSI breaks 50, trading volume expands.
• On-chain data: TVL breaks 6.5 billion, DEX trading volume increases.#ETH
