$BTC • Current time and price: May 24, 2025, 05:07 HKT (Hong Kong Time), BTC price is 108320.57 USD
Creating is not easy! Please like and follow! Thank you🌹
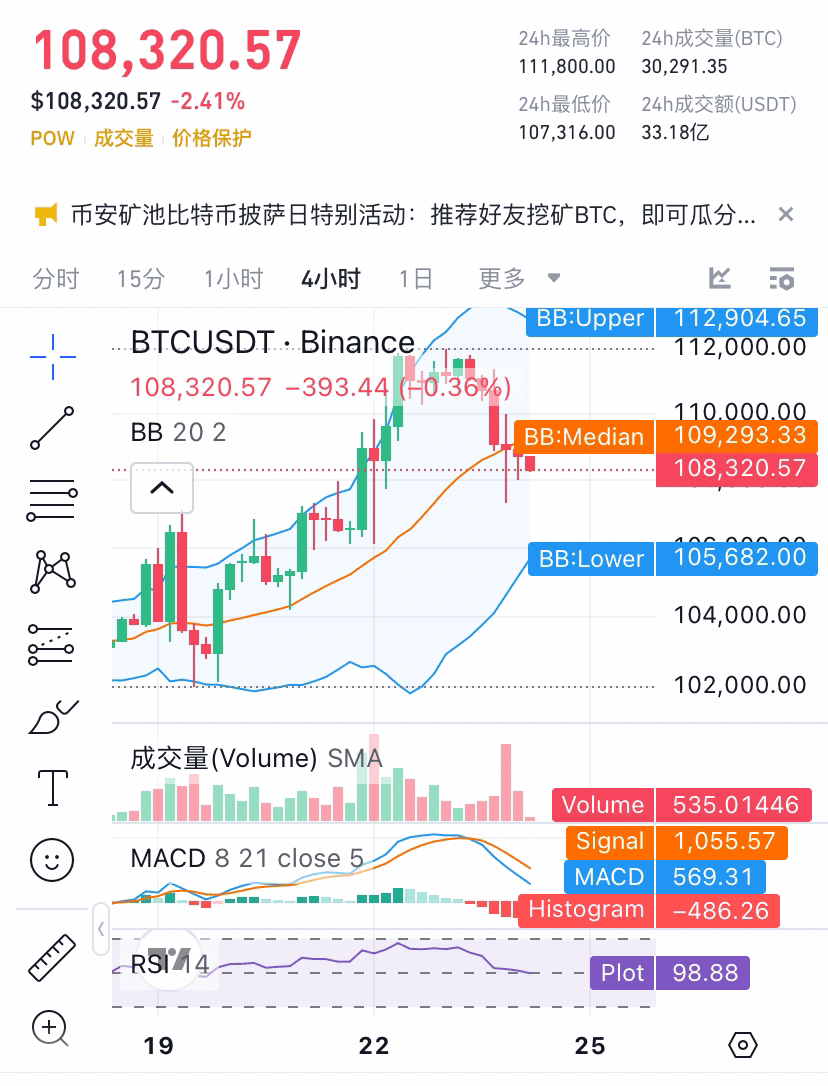
Detailed Analysis of Technical Indicators (Based on Binance 4-Hour K-Line Chart)
Price Trend
• Bollinger Bands (BB 20 2):
• Upper Bound: 112,904.65 USD
• Middle Band: 109,293.33 USD
• Lower Bound: 105,682.00 USD
• Current price 108320.57 USD is below the middle band (109,293 USD), close to the lower band (105,682 USD), indicating that short-term bearish momentum prevails, but if it touches the lower band, it may trigger a rebound.
• Volume (Volume SMA):
• Current volume is 35.01446, recent volume has decreased, indicating reduced market participation and may enter a consolidation phase.
• MACD (8, 21, Close, 5):
• MACD Line: 569.31
• Signal Line: 1,055.57
• Histogram: -486.26
• MACD line is below the signal line, and the histogram is negative, showing bearish momentum. The negative histogram is expanding, and the short-term downward trend may continue, but if it narrows, it may indicate a reversal.
• RSI (14):
• RSI Value: 98.88
• RSI Extremely Overbought (>70), although the price has dropped 2.41%, the indicator has not significantly retreated, indicating further retracement pressure.
• Multi-Cycle Performance:
• 5 Minutes: -0.56%
• 1 Hour: 3.96%
• 4 Hours: 16.23%
• 1 Day: 12.14%
• 7 Days: 12.96%
• 30 Days: 51.12%
• Medium to long-term trend is bullish (4 hours, 7 days, 30 days all up), short-term correction may be a normal adjustment.
Trading Sentiment
• Buy Orders: 1,810.003 BTC
• Sell Orders: 4,996.487 BTC
• Sell order volume is 2.76 times the buy order volume, indicating strong selling pressure that may further push down prices.
3. Elliott Wave Analysis
Current Wave Position
• Long Cycle: BTC may be in the fifth wave (Wave 5) starting from the low point at the end of 2023 (49,121.24 USD), with the recent high of 111,970.17 USD (52-week high) possibly being a local peak of the fifth wave.
• 4 Hour Cycle: Currently may be in the fourth sub-wave (Wave 4) correction phase of the fifth wave, with prices falling from 111,800 USD to 108,615 USD. Alternatively, if the fifth wave has ended, it enters the A-B-C corrective structure's A wave.
• Correction Target:
• Wave 4 usually retraces to the 38.2%-50% Fibonacci retracement of Wave 3. Assuming Wave 3 rises from 104,000 USD to 111,800 USD:
• 38.2% Retracement: 108,700 USD (approaching).
• 50% Retracement: 107,900 USD.
• 61.8% Retracement: 107,000 USD.
• The Bollinger Band lower bound of 105,682 USD may be a stronger support level.
• Fifth Wave Target:
• If Wave 4 correction ends, the fifth wave may extend to 61.8%-100% of the rise of waves 1-3:
• 61.8% Extension: 112,500 USD.
• 100% Extension: 115,800 USD.
• Bollinger Band Upper 112,904.65 USD is the short-term target.
Possibility of Correction Wave (A-B-C)
• If the fifth wave has ended, the current decline may be Wave A, targeting 107,000-105,682 USD.
• Wave B rebound may reach 109,293 USD (Bollinger Band Middle), then Wave C may drop to 104,000 USD.
4. TVL Trend Analysis (DefiLlama Data)
• Current TVL: 669.4 million USD, recently surged 67.35% from 400 million USD, reflecting accelerated capital inflow.
• Historical Trends:
• 2021-2023: TVL Slow Growth (0-200 million USD).
• 2024: Accelerated growth (200-400 million USD).
• May 2025: Explosive growth (4-669.4 million USD), increasing by 269.4 million USD within 48 hours.
• Relationship with price:
• TVL growth outpaces price increase (BTC price up 51.12% in 30 days, TVL up 67.35%), indicating that capital inflow is independent of short-term price fluctuations.
• TVL growth may absorb circulating supply, supporting prices and avoiding significant declines.
• Future Trends:
• Short-term: If TVL breaks 700 million USD, it may push prices up to 112,904.65 USD.
• Medium-term: TVL may stabilize at 600-800 million USD, long-term target 1-1.5 billion USD.
5. Comprehensive Market Dynamics
• Short-term Pressure:
• MACD bearish, RSI overbought, heavy selling pressure, price may continue to dip to 107,000-105,682 USD.
• Medium to Long-Term Support:
• TVL growth (669.4 million USD) shows strong capital inflow, up 51.12% in 30 days, indicating an overall bullish trend.
• Institutional funds (such as ETF inflows of 7.5 billion USD) support a long-term upward trend.
• Key Support and Resistance:
• Support Level: 107,000 USD (Wave 4 correction target), 105,682 USD (Bollinger Band Lower).
• Resistance Level: 109,293 USD (Bollinger Band Middle), 112,904.65 USD (Bollinger Band Upper).
6. Entry Recommendations
Based on the above analysis, the current market is in a short-term correction (possibly Wave 4 or Wave A), but the medium to long-term trend is bullish. Combining technical indicators and TVL trends, I recommend buying on dips, detailed as follows:
Buy on dips recommendation
• Entry Point:
• Best entry range: 107,000-105,682 USD.
• Reason: Price is close to the 50%-61.8% retracement level of Wave 4 correction (107,900-107,000 USD), Bollinger Band lower bound of 105,682 USD is a strong support level, TVL growth provides fundamental support.
• Stop Loss Point:
• 104,000 USD.
• Reason: If it breaks below 105,682 USD, it may enter the C wave of the A-B-C correction, testing 104,000 USD (psychological barrier and previous support).
• Target Point:
• First Target: 109,293 USD (Bollinger Band Middle).
• Second Target: 112,904.65 USD (Bollinger Band Upper, Wave 5 target).
• Long-term target: 115,800 USD (100% extension of the fifth wave).
• Profit Potential:
• From 105,682 USD to 112,904 USD, an increase of about 6.83% (7,222 USD).
• From 105,682 USD to 115,800 USD, an increase of about 9.58% (10,118 USD).
• Risk-Reward Ratio:
• Risk: 105,682 USD - 104,000 USD = 1,682 USD.
• Return: 112,904 USD - 105,682 USD = 7,222 USD.
• Risk-reward ratio is about 1:4.3, suitable for short-term trading.
Why is it not recommended to short at highs?
• TVL growth: The locked value of 669.4 million USD shows strong capital inflows, which may limit downside space.
• Medium to long-term trend is bullish: 4 hours up 16.23%, 30 days up 51.12%, overall trend does not support shorting.
• Potential Rebound: Price is close to the Bollinger Band lower bound (105,682 USD), RSI overbought may gradually digest, with a high probability of rebound.
Trade Execution Recommendations
1. Wait for Confirmation:
• Observe whether the price stabilizes in the 107,000-105,682 USD range, and pay attention to whether trading volume increases (increased volume rebound is a buy signal).
• If RSI falls below 70 (e.g., 50-60), it indicates that overbought pressure has eased, making it suitable for entry.
2. Capital Management:
• It is recommended to build positions in batches, initially buying 50% of the position (around 107,000 USD), and if it drops to 105,682 USD, add 30%, with the remaining 20% added based on rebound strength.
• Total position controlled at 5%-10% of account funds to cope with volatility risk.
3. Take Profit Strategy:
• Reduce position by 50% near 109,293 USD to lock in some profits.
• If it breaks 112,904 USD, the remaining position can be held until 115,800 USD.
7. Risk Warning
• Short-term Risk:
• Heavy selling pressure (4,996.487 BTC vs 1,810.003 BTC), price may break below 105,682 USD, triggering stop losses.
• If TVL growth slows or funds withdraw, support may weaken.
• Macro Risk:
• Regulatory policies (such as cryptocurrency bans) or black swan events may affect market sentiment.
• DeFi protocol vulnerabilities may lead to a decrease in TVL, indirectly affecting prices.
• Countermeasures:
• Strictly execute stop losses to avoid emotional trading.
• Pay attention to on-chain data (such as on-chain fees and trading volume) and news dynamics.
8. Conclusion
The current BTC price is 108,615 USD (May 24, 2025, 05:07 HKT), in a short-term correction phase (possibly Wave 4 or Wave A), but the TVL growth (669.4 million USD) and medium to long-term trend (30 days up 51.12%) support a bullish outlook. It is recommended to buy on dips, entering in the 107,000-105,682 USD range, with a stop loss at 104,000 USD, targeting 112,904.65 USD or 115,800 USD. The risk-reward ratio is good (1:4.3), but one must be cautious of short-term selling pressure and market volatility.#加密市场回调
Disclaimer: The cryptocurrency market is highly volatile, investing involves risks, and the above suggestions are for reference only and do not constitute investment advice. Please operate cautiously according to your own risk tolerance.

